EngageNY
Linear and Exponential Models—Comparing Growth Rates
Does a linear or exponential model fit the data better? Guide your class through an exploration to answer this question. Pupils create an exponential and linear model for a data set and draw conclusions, based on predictions and the...
West Contra Costa Unified School District
Solving Inequalities
What does translating points on a number line have to do with solving inequalities? Young mathematicians first learn about translations of points on a number line, and then use this information to solve linear inequalities in one variable.
Curated OER
Using Math to Draw the Mayflower
Third graders access information from a website about the Pilgrims trip on the Mayflower and discuss the number of people on the ship and the time they spent on the ship. They draw, label and measure the Mayflower to perspective.
Curated OER
Iterating Linear Functions
Learners use a spreadsheet to investigate data. In this algebra lesson, students collect and graph data on a coordinate plane. They explain properties of a linear equation both algebraically and orally.
Illustrative Mathematics
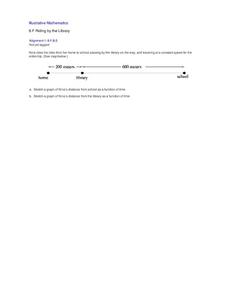
Riding by the Library
Draw a graph that shows the qualitative features of a function that has been described verbally. Make sure learners understand where time is zero and the distance is zero. It may take them some time to understand this concept, so working...
Hawaiʻi State Department of Education
Railroad Tracks
Ahhh the vanishing point! Sounds ominous, but it's not. Fifth graders analyze the use of perspective in Renaissance art. They practice using linear perspective to draw railroad tracks that seem to go on forever. Tip: Make this lesson as...
Curated OER
Linear-Quadratic Inequalities
High schoolers graph linear and quadratic functions. In this algebra lesson, students create graph with specific coordinate points. They use the Ti to visualise and differentiate between the two functions.
Curated OER
Dimensional Space: Various Perspectives
Students use their understanding of 3D on 2D to make a representation of a 4D form on paper.
Curated OER
Atlatl Lesson Grades 4-12
Tenth graders explore the weapons of the Aboriginal people. In this tenth grade mathematics instructional activity, 10th graders investigate how throwing with an atlatl increase the speed of the dart as it is thrown. Students calculate...
Teach Engineering
The Challenge Question
A research position becomes a modeling job. The introductory lesson in a series of nine presents the challenge of analyzing a set of bivariate data. The class brainstorms what the data may represent. Pupils must decide what is needed to...
Kenan Fellows
Density
Most scholars associate density with floating, but how do scientists determine the exact density of an unknown liquid? The third lesson in a seven-part series challenges scholars to find the mass and volume of two unknown liquids. Each...
Curated OER
Families of Functions
Students investigate families of functions. In this families of functions lesson, students discuss how changing a functions parameters affect its' graph. Students vary slope and y-intercepts of linear functions. Students stretch and...
Curated OER
Can You Make a Hole in One?
Young scholars relate miniature golf to reflection of an image. In this algebra instructional activity, students collect and graph data as they study linear equations. They apply properties of graphing to solve real life scenarios.
EngageNY
First-Person Computer Games
How do graphic designers project three-dimensional images onto two-dimensional spaces? Scholars connect their learning of matrix transformations to graphic design. They understand how to apply matrix transformations to make...
Curated OER
How Does Your Population Grown?
Do you know how the population has grown of your community? Can you predict the population over the next half century? Can we find an algebraic model that matches our data? These along with many more questions can be researched by...
Curated OER
Exploring Arrangements of 2, 3, 4, and 5 Cubes
Learners construct models of various tricubes, tetracubes, and pentacubes that are possible, classify n-cubes into different groupings, and draw these figures on isometric dot paper giving true perspective to what they visualize.
Curated OER
Gender and Income
Students investigate Income and gender preference. For this statistic lesson, students collect data of Income to see if one gender makes more than the other. Students examine the data and draw conclusions.
Curated OER
Surface Area and Volume of a Cube
Students explore finding the surface area and volume of cubes and cylinders. They construct similar three-dimensional figures from a two-dimensional drawing. Students derive the formula for volume and surface area through examination...


