Curated OER
Profitable Soda Stand
Am I making any money? Help learners determine if their fictitious soda stand is turning a profit. They graph linear equations using the slope and y-intercept and identify the best price to use to sell soda. They identify the domain and...
Curated OER
Reading Graphs
Working independently or in teams, your class practices connecting graphs, formulas and words. This lesson plan includes a guided discussion about distance vs. time graphs and looking at how velocity changes over time.
EngageNY
Modeling with Polynomials—An Introduction (part 2)
Linear, quadratic, and now cubic functions can model real-life patterns. High schoolers create cubic regression equations to model different scenarios. They then use the regression equations to make predictions.
Curated OER
Thirst Dilemma (Drinking in the Desert)
Ninth graders explore linear functions. In this Algebra I lesson, 9th graders collect and analyze date as they investigate the question of how long will water last if you are trapped in a desert. Students create scatterplots of their...
Curated OER
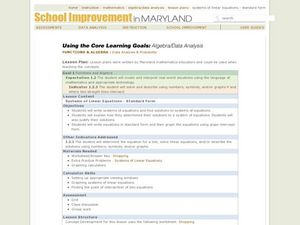
Functions & Algebra
Students examine linear equations. For this functions and algebra lesson, students write equations in the slope-intercept form. They enter data in a graphing calculator, examine tables, and write linear equations to match the data.
Curated OER
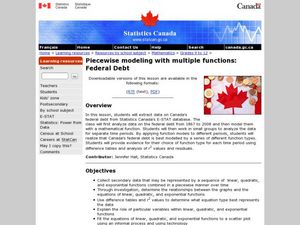
Piecewise Modeling with Multiple Functions: Federal Debt
Students analyze data on debt and write an equation. In this statistics lesson plan, students are given data from different time periods, and are asked to graph and analyze the data. They work in groups, and are assigned different parts...
Curated OER
Walking on Air
Students collect and analyze data with a graph. In this statistics lesson, students use central tendencies to find the meaning of their data. They display the data on a Ti calculator.
Curated OER
Linear Relationship
Students use a graphing calculator to examine the association between the data points and equation of a linear relationship. They write equations in slope- intercept form. Answer key included.
Curated OER
Linear Relationships - Standard Form
Students use a graphing calculator to examine the association between the data points and equation of a linear relationship. They write equations in standard form and then graph the equations using the slop-intercept form. Answer Key...
Curated OER
TI-Nspire Activity: What Does Your Representation Tell You?
By learning to select the best representation for three meal plans, students compare three meal plans to determine the best choice. Data for the meal plans is sorted on a table, as an algebraic equation, and graphed on a coordinate grid....
Mathalicious
XBOX Xpotential
Touchdown! This is an exponentially insightful lesson that explores the growth of football games with different video game consoles. Class members discuss whether the increase of mergahertz can be described as linear or exponential. The...
Curated OER
How Do They Relate? Linear Relationship
Students collect information and use a line to represent it. In this algebra instructional activity, students investigate real world data to see if it makes a line. They graph the line comparing the relationship of the x axis with that...
EngageNY
More on Modeling Relationships with a Line
How do you create a residual plot? Work as a class and in small groups through the activity in order to learn how to build a residual plot. The activity builds upon previous learning on calculating residuals and serves as a precursor to...
Virginia Department of Education
Slippery Slope
Explore slope using geometric patterns. Young mathematicians investigate towers built from cubes to develop a linear pattern. They move the data to a coordinate plane to connect the pattern to slopes.
Curated OER
Introduction to Functions
Students explore functions, function rules, and data tables. They explore terms of linear functions. Students use computers to analyze the functions. Students write short sentences to explain data tables and simple algebraic expressions.
Curated OER
Patterns and Functions
Students investigate properties of perimeter and area. In this middle school mathematics lesson, students explore patterns in a problem solving context. Students model and solve problems using various representations for the data as...
Curated OER
VARIABLES AND PATTERNS, USE AFTER INVESTIGATION THREE. DISCRETE OR CONTINUOUS LINEAR RELATIONS.
Students discover for which kind of linear function is appropriate to use the "scatter" or the "connected" term. In this lesson, students investigate functions using variables, patterns book, graph paper, rulers and the graphit program.
Curated OER
Making Money and Spreading the Flu!
Paper folding, flu spreading in a school, bacteria growth, and continuously compounded interest all provide excellent models to study exponential functions. This is a comprehensive resource that looks at many different aspects of these...
Curated OER
Model and Solve Algebraic Equations
Examine multiple ways to solve algebraic equations. Pupils will generate a problem solving strategy that addresses the prompt given by the teacher. They will then share their problem solving strategy with the class. Graphic organizers,...
Curated OER
Graphs and Functions
Use this series of activities to introduce learners to graphing functions. They graph both linear and quadratic equations by hand and with a Graph Sketcher Tool. Several imbedded links and handouts are included in the lesson.
Curated OER
Math: Methods of Measurement
Fourth graders practice linear measurement skills by applying various measuring instruments to determine the heights of classmates. By measuring the heights of second graders and fourth graders, they construct tables of height and age...
EngageNY
Informally Fitting a Line
Discover how trend lines can be useful in understanding relationships between variables with a lesson that covers how to informally fit a trend line to model a relationship given in a scatter plot. Scholars use the trend line to make...
Curated OER
Confusing Colors!
Fourth graders collect data, graph their data, and then make predictions based upon their findings. They's interest is maintained by the interesting way the data is collected. The data collection experiment is from the psychology work of...
Curated OER
Mathematics Within: Algebraic Patterns
Students discover patterns in linear equations by playing a dice game to collect data. They graph the data and analyze the patterns of the lines created by the data. The class then compares the individual graphs to evaluate the position...


