Radford University
Green Cravings
Build up a bag of green. Pupils determine the number of green Skittles in a snack bag and come up with a way to determine how many snack bags it would take to create one bag of only green Skittles. Classmates share their methods and...
Radford University
At the Gas Pump
Given the price of crude oil, gasoline, and diesel for the past several years, pupils plot the data to determine whether a correlation exists. Learners determine a regression line and predict the price of gasoline and diesel in the...
Curated OER
Aboriginal Hand Prints
A part of a study of Australian Aboriginal culture, class members listen to a Dreamtime story about a father who stenciled his handprint on a rock wall. Class members then make their own hand print art representative of themselves...
Curated OER
More of U.S.
Explore graphical representation of a real-life data set and determine the exponential regression model for the data in your classroom. Students also compare the estimated value to the given value by determining the percent error.
Curated OER
Plotting Temperature and Altitude
students convert the temperature readings from degrees Celsius to degrees Fahrenheit. they predict and create a graph of what the graph of altitude (x-axis) versus temperature in degrees Fahrenheit (y-axis) might look like.
Curated OER
Battery Depletion and Piecewise Linear Graphing
Students examine a recent flight of Pathfinder. In groups, they use the information to create a table of values showing the battery charge of the space machine. They predict what the charge would be further on in the mission. They use...
Curated OER
Integer Algebraic Addition
Students use algebra tiles to solve linear equations with integer solutions. In this algebra lesson plan, students use the additive inverse and the zero pair concept.
Curated OER
Exponential Growth and Exponential Functions
Students explore the concept of exponential functions. In this exponential functions lesson plan, students model exponential growth about a high school population using an applet. Students manipulate the applet to show the effect that a...
Curated OER
Water in the Texas Coastal Basins
Learners, after researching a Texas coastal basin, map and graph the information they collect and then translate it into a short report to be presented to their classmates. They brainstorm unique ways to maintain Texas estuaries as well...
Curated OER
Saving the Bald Eagle
Students plot on a coordinate plane. In this algebra lesson, students identify points on a coordinate plane and graph lines given coordinate pairs. They create a model as they study bald eagles and their growth and decay.
Curated OER
Direct and Inverse Variation
Eighth graders participate in two data collection activities that involve direct and inverse variation. In the pre-assessment, 8th graders categorize numerical, graphical, and verbal representations as linear or nonlinear and determine...
Curated OER
Introduction to Solving Quadratic Equations by Factoring
Students solve quadratic equations. In this algebra lesson plan, students factor and graph linear and quadratic functions. They identify the standard and linear form of each equation.
Curated OER
Slippery Slope
Students define patterns, relation and function. In this algebra lesson, students find the slope of a line and write equations of line. They model the slope using real life scenarios.
Curated OER
Position and Piecewise Velocity
Students solve piecewise functions. In this precalculus lesson, students model real life scenarios using velocity and piecewise. They create velocity graphs and find the beginning and end position of an object.
Curated OER
Perfect Shuffles
Students investigate piecewise functions. In this algebra lesson, students model piecewise functions in the real world. They graph the parts of the functions following the restrictions of the domain.
Curated OER
Race The Rapper: Slopes
Students calculate the slope of the equation In this algebra instructional activity, students graph coordinate pairs of linear equations and identify the relationship between x and y values and slope. They differentiate between...
Curated OER
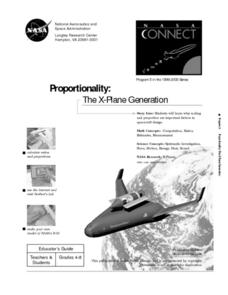
Proportionality: The X-Plane Generation
Students meet NASA researchers who describe the relationship between force, energy and motion. They discuss how NASA's experimental X-plane is being tested to make space travel more reliable and show how proportionality and ratios are...
Curated OER
Exploring Arrangements of 2, 3, 4, and 5 Cubes
Students use problem solving skills to create various models of tricubes, tetracubes, and pentacubes. They classify the cubes into various groupings and identify them as mirror images, regular arrangements, and irregular arrangements....
Curated OER
Optimization For Breakfast
Young scholars identify he proportion of a cereal box. In this algebra activity, students define the relationship between patterns, functions and relations. They model their understanding using the cereal box.
Curated OER
Hybrid Vehicles: Cut Pollution and Save Money
Young scholars examine how driving a hybrid car can save money and cut down on pollution. In this hybrid vehicles lesson students complete an exercise that shows them how to work with proportions, percents, dimensional analysis and...
Curated OER
Causal Patterns in Air Pressure Phenomena
Learners explore air pressure. They observe what happens when you drink from a straw. Students experiment and create models to prove examine air pressure and vacuums. Slearners contrast how linear and relational casusal models explain...
Curated OER
Solving One Step Equations Using Algebra Tiles
Students solve linear equations. In this algebra lesson, students solve equations using addition, subtraction, division and multiplication. They evaluate and simplify functions.
Curated OER
Choose Your Own Adventure Story
Students investigate the concept of writing adventure stories. They follow the model of a "choose your own adventure story". Students practice the skill of making choices to get to a desired outcome. The application is when they follow...
Curated OER
The Farther Away You Are, The Faster Away You Move
Learners explore linear relationships. The lesson uses science to develop an understanding of the expanding Universe. There are 3 Labs, only 2 of which are required. Lab C is an enrichment for higher level classes.


