Mathematics Assessment Project
Maximizing Profits: Selling Boomerangs
You'll return to this resource again .. .and again ... and again. Class members determine the maximum profit of a boomerang-making business by solving a system of equations. They then review and analyze provided sample responses to...
Bowland
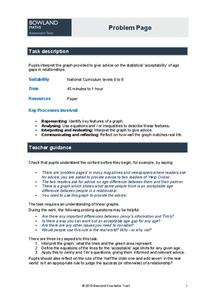
Problem Page
Future mathematicians use a given graph to answer a question about age differences in relationships. Along the way, they must find the equation and inequality of given graphs.
Inside Mathematics
Conference Tables
Pupils analyze a pattern of conference tables to determine the number of tables needed and the number of people that can be seated for a given size. Individuals develop general formulas for the two growing number patterns and...
CCSS Math Activities
Picking Apples
Pick the resource while it's ripe. A performance task challenges young mathematicians to consider the costs of apple picking. They compare the costs for two different orchards for different situations.
EngageNY
Solution Sets to Equations with Two Variables
Can an equation have an infinite number of solutions? Allow your class to discover the relationship between the input and output variables in a two-variable equation. Class members explore the concept through tables and graphs and...
EngageNY
More Examples of Functions
Discrete or not discrete? Individuals learn about the difference between discrete and non-discrete functions in the fourth installment of a 12-part module. They classify some examples of functions as being either discrete or non-discrete.
EngageNY
Modeling a Context from a Verbal Description (part 1)
When complicated algebraic expressions are involved, it is sometimes easier to use a table or graph to model a context. The exercises in this lesson are designed for business applications and require complex algebraic...
Kenan Fellows
How Does an Unhealthy Diet Influence our Health and Well-Being?
You are what you eat, or so they say! After surveying family and friends on a week of eating habits, learners analyze the data for patterns. They compare different variables such as fats and cost, fats and calories, or fats and LDLs.
Virginia Department of Education
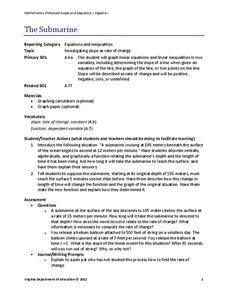
The Submarine
Submerge yourself in the study of slope. Scholars investigate a situation involving slope and the rate of change of a submarine. An additional example further explores the concept of slope by changing one of the conditions of the submarine.
Virginia Department of Education
Transformationally Speaking
Young mathematicians explore transformations of graphs by graphing sets of functions on the same pair of axes. They use their graphs to determine the effect that the values of a and b in y = ax + b have on the graph of y = x.
Curated OER
Scale Skills
For this mapping skills worksheet, students read an excerpt that describes three different types of scales and how to calculate distance on a map. They respond to two short answer questions using the map provided on the sheet and to...
Texas Instruments
TI-Nspire™ CAS
When it comes to rating educational calculators, this calculator is always near the top of this list. Now it's available as an app. There is a lot of calculator power wrapped up in this app. Not only is this a fully functioning...
Texas Instruments
TI-Nspire™
We landed on the moon with less computing capabilities than you can find in this app! Here is a multiple function calculator that takes all the power you get from a handheld and adds the wonderful large screen that only a tablet can...
University of California
Student Workbook: Algebra I
Need a helping hand in Algebra I? How about a giant, super-sized worksheet packet? Here is a resource that has worksheets for virtually every concept with some accompanying examples.
Curated OER
Make a Pass at Me
Learners identify different types of functions and units of measurements. In this statistics lesson plan, students will collect data, graph their data and make predictions about their data. They plot a linear regression graph.
Curated OER
Cramer's Rule ID: 8793
Mathematicians are introduced to Cramer’s Rule and use it to solve three systems that have one solution, no solutions, and an infinite number of solutions. Students use TI-Nspire to graph the systems to verify their answers and...
Curated OER
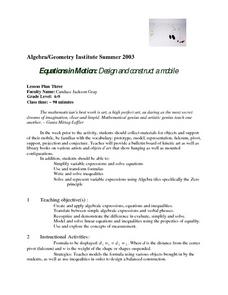
Equations in Motion: Design and construct a mobile
Learners participate in a lesson that covers the concepts of solving equations and inequalities. To master the concept they must demonstrate visually and verbally how both sides of an equation must be balanced. They construct a balanced...
Curated OER
Spaghetti Graphs
Students work in pairs to test the strength of spaghetti strands. They collect and graph data to determine a line of best fit. Students create a linear equation to interpret their data. Based on the data collected, students predict...
Curated OER
AnaLyzing Equations Through Slope and Y Intercept.
Students analyze and solve linear equations. In this algebra lesson, students solve inequalities using the slope and y intercept. They rewrite word problems into algebraic equations and solve for the unknown.
Curated OER
Solving Equations
In this algebra worksheet, 11th graders solve a variety of problems using linear and quadratic properties as they pertain to functions. There are 12 questions.
Curated OER
Solving Two Step Equations
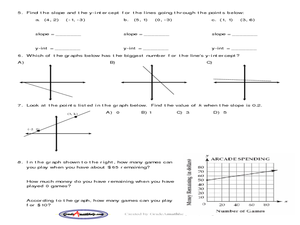
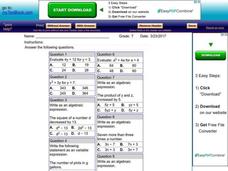
In this algebra worksheet, students solve linear equations using the slope and y-intercept. They solve word problems using algebra. There are 9 questions with an answer key.
Curated OER
Flow of Information
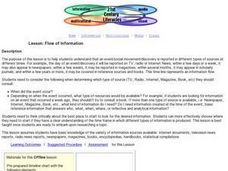
Students examine how information follows a linear path. They identify types of sources they need to consult and where it falls in the information flow, simulate the role of historians, and generate a list of sources for a topic.
Curated OER
Solving Equations
In this algebra worksheet, students solve linear equations and quadratic equations by factoring, distribution and evaluating. There are 12 questions with an answer key.
Curated OER
Equations of Lines Perpendicular and Parallel
In this algebra worksheet, students solve linear equations using one and two steps. They solve systems of equations using substitution and elimination with graphing. There are links for ready made tests and quizzes.
Other popular searches
- Graphing Linear Inequalities
- Solving Linear Inequalities
- Systems of Linear Inequalities
- One Step Linear Inequalities
- Solve Linear Inequalities
- History Linear Inequalities
- Linear Inequalities Graph
- Algebra Linear Inequalities
- System of Linear Inequalities
- Two Step Linear Inequalities
- System Linear Inequalities
- Nonlinear Inequalities


