University of South Florida
Fcat: Spaghetti Bridges: Teacher Notes
Students build bridges and test their strength to collect data and write an equation. The concept of slope is explored in this activity.
Alabama Learning Exchange
Alex: Systems of Equations: What Method Do You Prefer?
The purpose of this instructional activity is to help students apply math concepts of solving systems of equations to real life situations. The students will use the three methods of graphing, substitution, and elimination to solve the...
Khan Academy
Khan: Lsn 8: Interpreting Relationships in Scatterplots/graphs/tables/equations
This instructional activity focuses on Interpreting and analyzing linear, quadratic, and exponential models and graphs. Students will use best fit lines to interpret contexts, distinguish whether contexts are linear or exponential...
University of Regina (Canada)
University of Regina: Math Central: Linear Graphs
Students gain the knowledge of how to plot and recognize first degree equations on a graph. The lesson plan has an overview, materials, procedures, and evaluation techniques.
University of Regina (Canada)
University of Regina: Math Central: Linear Graphs
Students gain the knowledge of how to plot and recognize first degree equations on a graph. The lesson has an overview, materials, procedures, and evaluation techniques.
Alabama Learning Exchange
Alex: Graphing Is Great!
Learners will explore graphing individually and in groups. They will also use an interactive activity to discuss slope and intercepts. To assess the instructional activity, students will use the floor tiles in the classroom as a large...
University of Regina (Canada)
University of Regina: Math Central: Introduction to Slope for Middle Years Mathematics
This collection of five middle school math lessons covers the topic of plane geometry, specifically the concept of slope. The first lesson introduces students to plotting points on a Cartesian grid using a Geoboard. Lesson two moves them...
Alabama Learning Exchange
Alex: Finding the Slope of a Line
This lesson will use a slide presentation to facilitate teaching students how to find the slope of a line when given the graph of the line or two points. Students will interact with the presentation in two ways: first, by taking notes...
Alabama Learning Exchange
Alex: Systems on a Mission
After solving one system of equations by the methods of graphing, elimination using addition or subtraction, elimination using multiplication, and substitution, students will be given four systems to be solved by one of each of the four...
University of South Florida
Fcat: Shaq's Hand/foot Span: Teacher Notes
Young scholars compare their own hand/foot span to Shaquille O'Neal's, then graph the data & construct a best-fit line. They can then use the information to investigate the proportionality of the human body.
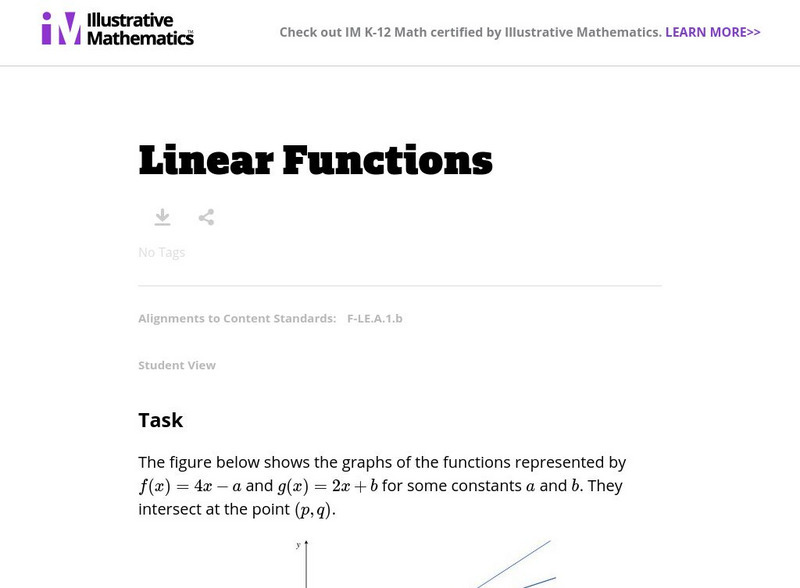
Illustrative Mathematics
Illustrative Mathematics: F Le Linear Functions
In this problem, students are presented with the equations of two linear functions and their intersecting graphs. They are asked to label the graphs and compute values for several points on the graphs. Aligns with F-LE.A.1.b.
Alabama Learning Exchange
Alex: Battleships
This lesson is designed to review and reinforce three methods (graphing, substitution and elimination) of solving systems of linear equations. The students will work together and independently to find the solutions to systems of...
Illustrative Mathematics
Illustrative Mathematics: A ced.a.2 and a ced.a.3: How Much Folate?
This task is designed to be used as an introduction to writing and graphing linear inequalities. Aligns with A-CED.A.2 and A-CED.A.3.
Illustrative Mathematics
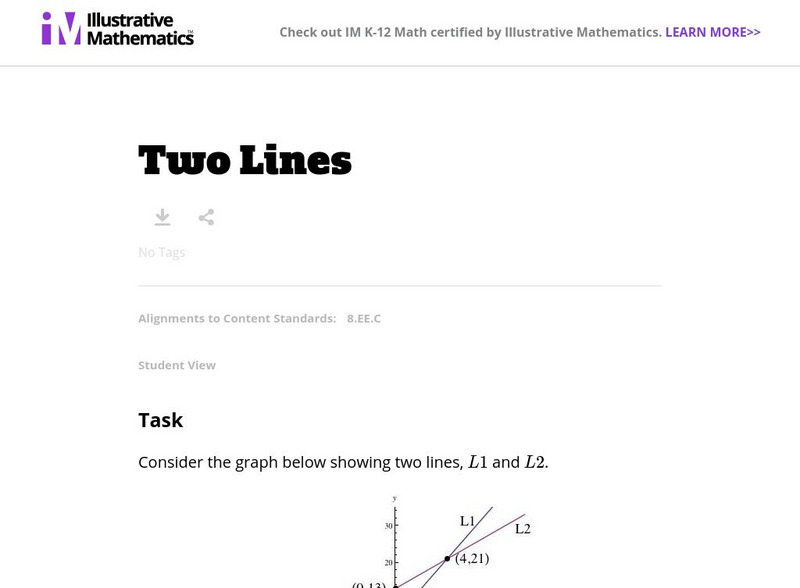
Illustrative Mathematics: 8.ee Two Lines
This task presents students with two line graphs. They are asked to find the linear equations and to identify points unique to each graph. Aligns with 8.EE.C.
Illustrative Mathematics
Illustrative Mathematics: 8.ee Cell Phone Plans
In this task, 8th graders examine the fee structures and features of three cell phone plans to highlight the advantages of each. They will need to write linear equations and draw graphs for each. They then choose the best plan for a...
Illustrative Mathematics
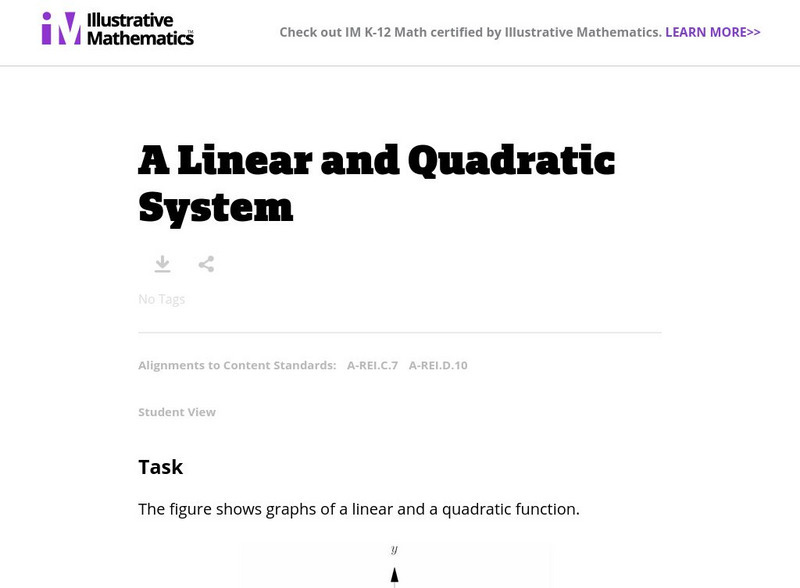
Illustrative Mathematics: A rei.c.7 & a rei.d.10: A Linear and Quadratic System
The purpose of this task is to give students the opportunity to make connections between equations and the geometry of the graphs. Aligns with A-REI.C.7and A-REI.D.10.
Shodor Education Foundation
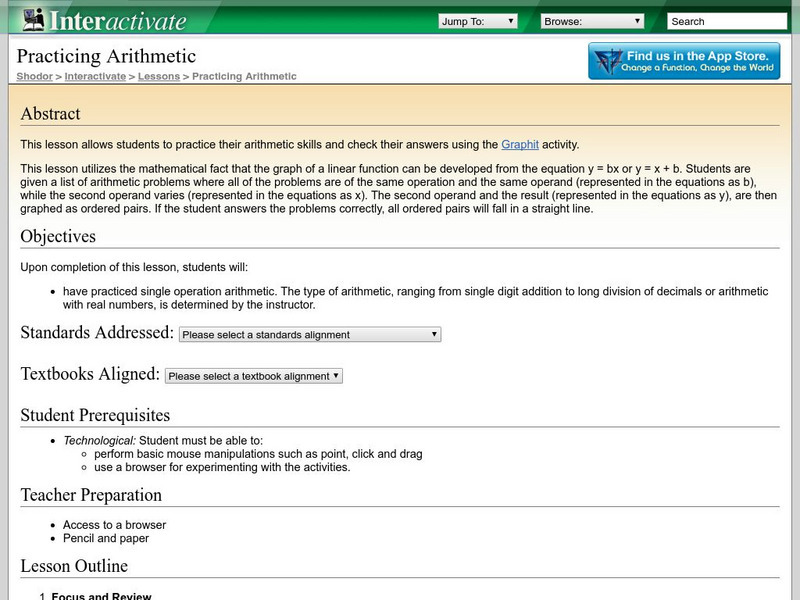
Shodor Interactivate: Lesson: Arithmetic Practice W/ Ordered Pairs
The Shodor Education Foundation provides this lesson plan to have students practice simple computation that results in them graphing their answers. If they are accurate they will have a straight line. Students use an interactive...
Khan Academy
Khan Academy: Lsn 13: Systems of Equations, Algebraic and Graphical Representations
Lesson 3 of 4 for Passport to Advanced Math. Learners will solve systems of equations in two variables in which one equation is linear and the other equation is quadratic or another nonlinear equation; relate properties of the function f...
Alabama Learning Exchange
Alex: Human Slope
Students will participate in this discovery activity intended for them to uncover the role each variable plays in the graph of a line in the form y = mx + b. Students will actually demonstrate lines in slope intercept form on a life size...
Alabama Learning Exchange
Alex: A Piece of Pi
This lesson uses graphing to help students understand that pi is a constant and is the slope of the line graphed on a circumference vs. diameter graph.This lesson plan was created as a result of the Girls Engaged in Math and Science...
Other
Nearpod: Slope Intercept Form
In this lesson on slope-intercept form, students will learn how to write and graph a linear function using the slope-intercept form by learning about the y-intercept and slope.
Illustrative Mathematics
Illustrative Mathematics: A rei.c.6: Estimating a Solution via Graphs
The purpose of this task is to give students an opportunity use quantitative and graphical reasoning to detect an error in a solution. Aligns with A-REI.C.6.
Illustrative Mathematics
Illustrative Mathematics: A rei.c.6: Accurately Weighing Pennies Ii
This illustrated math lesson shows how important levels of accuracy in measurement are. The answer can be different since a scale only accurately weighs to the nearest tenth of a gram instead of to the nearest hundredth of a gram. Aligns...
PBS
Pbs Teachers: Sports and Math: Will Women Athletes Ever Catch and Surpass
Explore, explain and make conclusions based on graphs of scatter plots of the Olympic records for men and women in the same event over the same years. Plot x- and y-values, and create linear equations from the data.
Other popular searches
- Graphing Linear Equations
- Graphing Lines
- Graphing Linear Systems
- Graphing a Linear Equation
- Algebra Graphing Lines
- Graphing Lines Quilt Pattern
- Graphing Nonlinear Equations
- Pre Algebra Graphing Lines
- Graphing. Linear Equation
- Area Graphing Lines
- Ged Graphing Lines


