Curated OER
An Exploration of the Slope of a Line
Students define the slope of a line. In this algebra lesson, students differentiate between parallel and perpendicular lines using their slopes. They rewrite equations in slope intercept form and explain the meaning of the slope.
Curated OER
Visual Structures of Postulates and Axioms in Algebraic Operations
Students investigate Axioms and Postulates. In this proof and linear transformation of equations instructional activity, students explore axioms and postulates to solve linear equations. Students construct game cards to analyze the...
Curated OER
Square and Triangular Numbers
High schoolers use equations to represent practical situations. They solve linear equations and quadratic equations. The use of problem solving strategies is also developed.
Curated OER
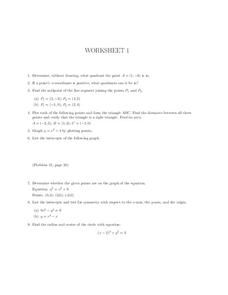
Worksheet 1, Coordinate Graphing
In this algebra worksheet, students determine the quadrant a given point is in. They find the midpoints of two line segments. Students plot points to form a triangle and find the distance between points. Students find the area of the...
Virginia Department of Education
Quadratic Curve of Best Fit
Class members create a table of the number of chords that can be drawn given the number of points on a circle. Pupils analyze the data created, find a function to fit to it, and use the function to make further predictions.
Kenan Fellows
How Does an Unhealthy Diet Influence our Health and Well-Being?
You are what you eat, or so they say! After surveying family and friends on a week of eating habits, learners analyze the data for patterns. They compare different variables such as fats and cost, fats and calories, or fats and LDLs.
EngageNY
More on Modeling Relationships with a Line
How do you create a residual plot? Work as a class and in small groups through the activity in order to learn how to build a residual plot. The activity builds upon previous learning on calculating residuals and serves as a precursor to...
Willow Tree
Direct and Inverse Variations
Enhance pupil understanding of proportions and variable relationships by studying direct and inverse variation. Use the idea of a proportional relationship to teach direct variation. Then use a similar pattern to help individuals...
Beyond Benign
Water Bottle Unit
How much plastic do manufacturers use to create water bottles each year? The class explores the number of water bottles used throughout the years to determine how many consumers will use in the future. Class members compare different...
Curated OER
Maximize It!
Students design a rectangular box without a lid that has the largest possible volume using the supplied sheet of centimeter graph paper. They work in groups to construct different size boxes to determine the largest possible volume and...
University of California
Student Workbook: Algebra I
Need a helping hand in Algebra I? How about a giant, super-sized worksheet packet? Here is a resource that has worksheets for virtually every concept with some accompanying examples.
Pennsylvania Department of Education
Alike and Different
Students compare and contrast objects and are introduced to a Venn Diagram. In this alike and different lesson plan, students make observations regarding properties of objects. Students classify object and build ideas about variables....
Curated OER
Correlation and Regression
In this statistics workshop young scholars find the value of linear correlation coefficients in three situations. Students find equations of the regression lines for 4 problems.
Curated OER
XY Graph
In this math worksheet, students practice graphing ordered pairs, linear equations, or quadratic equations using this graph with the x and y axis.
Curated OER
Advanced Introduction to TI-8x Calculators: Programming in TI-Basic
Students program a TI-Basic calculator. In this calculator programming lesson, students explore how to create and graph a linear equation. Students study how to input variables into the function and read the graph output.
Curated OER
Transformations and Exponential Functions
Tenth graders study graphing exponential functions. In this transformations lesson, 10th graders apply inquiry to determine how changes to a parent function affect its graph. Students analyze transformed graphs and generate the function...
Curated OER
Cost Calculations Lesson Plan
Students analyze data using graphs and equations. In this algebra lesson, students calculate the cost of lumber, convert price per foot to price per piece, solve equations using addition and subtraction and give exact answer when needed....
Curated OER
Calculator-Based Lessons Help Examine Real-World Data
Students may determine equations based on graphs and regression models.
Curated OER
Cantilevers
Students perform an experiment to find the linear relationship between the appllied weight and the bend of the cantilever. In this linear relationships activity, students follow detailed directions to set up an experiment. They add...
Curated OER
Solving Systems vis Elimination
Students solve systems of equation using elimination. For this algebra lesson, students identify the type of solutions produces by systems of equations. They discuss the type of lines formed given a linear pair.
Curated OER
Who's got the fastest legs?
Students use a stopwatch to collect information for a scatterplot. In this fastest legs lessons, students collect data through the taking of measurements, create and find a median number. Students develop an equation and answer...
Curated OER
Math Regents Exam Questions: Graphing Rational Functions
For this graphing rational functions worksheet, students answer 18 multiple choice problems about rational functions. Students determine values for a which a function is undefined given the equation of the function.
Curated OER
Rational Numbers
Young scholars investigate rational numbers in this algebra lesson. They graph systems of equations and use technology to find the point of intersection. They need a TI for this assignment.
Curated OER
Oodles of Poodles
Students solve equations by graphing. In this algebra lesson, students differentiate between functions and relations. They use the TI to graph their equation and analyze the graph.
Other popular searches
- Graphing Linear Equations
- Solving Linear Equations
- Systems of Linear Equations
- Writing Linear Equations
- Graphing Lines
- Algebra Linear Equations
- Linear Equations and Graphs
- System of Linear Equations
- Two Step Linear Equations
- Linear Equations Data
- Nonlinear Equations
- Slope of Linear Equations


