Illustrative Mathematics
Introduction to Linear Functions
Introduce your algebra learners to linear and quadratic functions. Learners compare the differences and relate them back to the equations and graphs. Lead your class to discussions on the properties of a function or a constant slope...
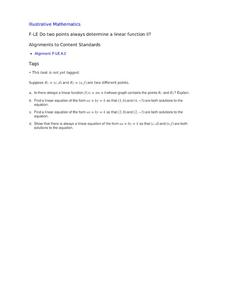
Illustrative Mathematics
Do Two Points Always Determine a Linear Function?
Your learners can approach this task algebraically, geometrically, or both. They analyze the building of a linear function given two points and expand the concrete approach to the abstract when they are asked to find the general form of...
Curated OER
Do Two Points Always Determine a Linear Function II?
Learners analyze the difference between the slope intercept and standard forms of a line in this task. Given two general points using letters they explore linear functions and linear equations.
PBL Pathways
Students and Teachers 2
Examine trends in student-to-teacher ratios over time. Building from the first task in the two-part series, classes now explore the pattern of student-to-teacher ratios using a non-linear function. After trying to connect the pattern to...
Curated OER
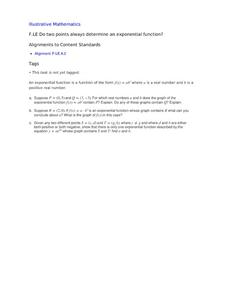
Do Two Points Always Determine an Exponential Function?
Algebra learners explore, analyze and build an exponential equation given its form and a specific point that exists on the function in this task. The last question asks learners to apply their ideas to an exponential equation given two...
Curated OER
Building a General Quadratic Function
Learners rewrite a general quadratic function by completing the square to see a new form of the function that more easily identifies the x-coordinate of the vertex and the two roots of the function.
Curated OER
Hand Span and Height
Is there a relationship between hand span width and height? Statisticians survey each other by taking measurements of both. A table that can hold data for 24 individuals is printed onto the worksheet, along with questions for analysis....
Howard County Schools
To Babysit or Not to Babysit?
Would you work for a penny today? Use this activity to highlight the pattern of increase in an exponential function. Scholars compare two options of being paid: one linear and one exponential. Depending on the number of days worked, they...
Teach Engineering
Using Hooke's Law to Understand Materials
Provide a Hooke for a lesson on elasticity with an activity that has groups investigate a set of springs. They use a set procedure to collect data to calculate the spring constant for each spring using Hooke's Law. The groups...
Texas Instruments
Texas Instruments: Mc Dougal Littell Mid. School Math: Graph Non Linear Functions
Students will compare functions by graphing the functions and describing the patterns in the graphs.
Texas Instruments
Texas Instruments: Mc Dougal Littell Prealgebra: Graphing Quadratic Functions
Students will compare the graph of Y=x^2 with the graph of the given functions
Math Notes and Math Tests
Pre Calculus Notes: Nonlinear Inequalities [Pdf]
Students explore nonlinear inequalities. Graphs and detailed examples are included.
Texas Instruments
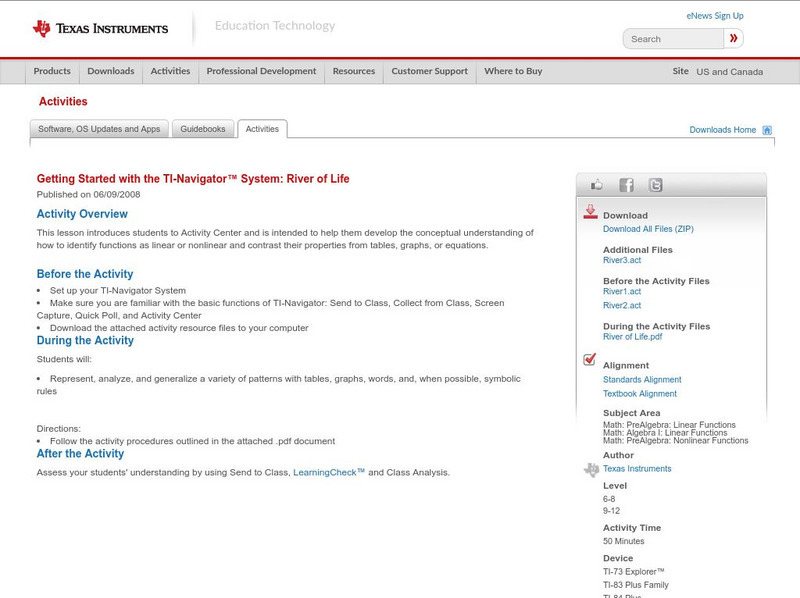
Texas Instruments: Getting Started With the Ti Navigator System: River of Life
This lesson introduces students to Activity Center and is intended to help students develop the conceptual understanding of how to identify functions as linear or nonlinear and contrast their properties from tables, graphs, or equations.
Texas Instruments
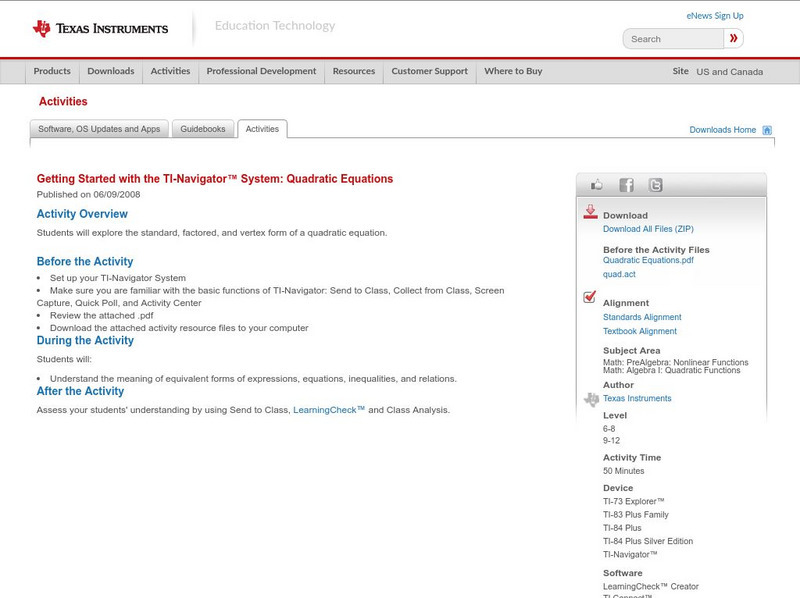
Texas Instruments: Getting Started With the Ti Navigator: Quadratic Equations
This lesson introduces students to Activity Center and is intended to help students write systems of equations in standard form in slope intercept form to solve the system using tables and graphs.
Richland Community College
Richland Community College: Math 116 Lecture Notes
This site from the Richland Community College provides the detailed lecture notes to a college algebra course, complete with equations and definitions. Content ranges from "functions and their graphs" to "conics and parametric equations."
Interactive Mathematics
Interactive Mathematics: Graphical Solution of Non Linear Systems
Using the graphing method, several systems of nonlinear equations are solved. Follow each example step by step to see how solutions are derived.






![Pre Calculus Notes: Nonlinear Inequalities [Pdf] Activity Pre Calculus Notes: Nonlinear Inequalities [Pdf] Activity](https://d15y2dacu3jp90.cloudfront.net/images/attachment_defaults/resource/large/FPO-knovation.png)
