Code.org
Making Data Visualizations
Relax ... now visualize the data. Introduce pupils to creating charts from a single data set. Using chart tools included in spreadsheet programs class members create data visualizations that display data. The...
Willow Tree
Line Plots
You can't see patterns in a jumble of numbers ... so organize them! Learners take a set of data and use a line plot to organize the numbers. From the line plot, they find minimum, maximum, mean, and make other conclusions about the...
Willow Tree
Line Graphs
Some data just doesn't follow a straight path. Learners use line graphs to represent data that changes over time. They use the graphs to analyze the data and make conclusions.
Charleston School District
The Line of Best Fit
If it's warm, they will come! Learners find a line of best fit to show a relationship between temperature and beach visitors. Previous lessons in the series showed pupils how to create and find associations in scatter plots. Now,...
Willow Tree
Box-and-Whisker Plots
Whiskers are not just for cats! Pupils create box-and-whisker plots from given data sets. They analyze the data using the graphs as their guide.
Willow Tree
Linear Relationships
There's just something special about lines in algebra. Introduce your classes to linear equations by analyzing the linear relationship. Young mathematicians use input/output pairs to determine the slope and the slope-intercept formula to...
Charleston School District
Increasing, Decreasing, Max, and Min
Roller coaster cars traveling along a graph create quite a story! The lesson analyzes both linear and non-linear graphs. Learners determine the intervals that a graph is increasing and/or decreasing and to locate maximum and/or...
Math Is Fun
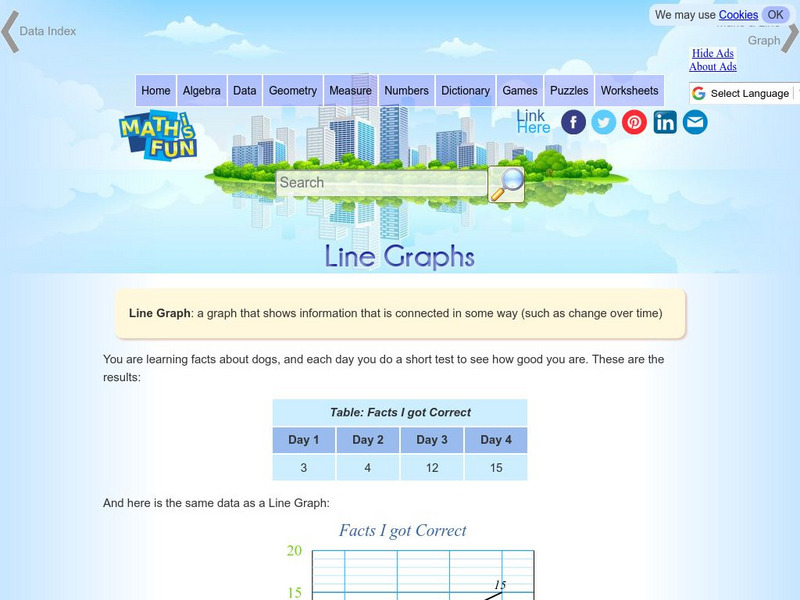
Math Is Fun: Line Graphs
Explains, with examples, what a line graph is and how to construct one. Includes a set of practice questions.
Quia
Ixl Learning: Line Plots
Brush up on your math skills relating to line plots then try some practice problems to test your understanding.
Quia
Ixl Learning: Dot Plots
Brush up on your math skills relating to dot plots then try some practice problems to test your understanding.
Other
University of Wisconsin Green Bay: Faults and Earthquakes
This site is primarily set up as an outline and is loaded with graphs, maps, and images. It covers a variety of earthquake-related topics, such as what causes earthquakes, fault lines and structures, seismology, a historical look at...


