EngageNY
Lines That Pass Through Regions
Good things happen when algebra and geometry get together! Continue the exploration of coordinate geometry in the third activity in the series. Pupils explore linear equations and describe the points of intersection with a given polygon...
Noyce Foundation
Between the Lines
Explore linear and square dimensions by comparing areas of similar figures. A creative set of five activities designed for elementary through high school classes asks young scholars to compare areas of specific polygons. The first two...
K-5 Math Teaching Resources
Blank Bar Graph Template
This template is just begging for your young mathematicians to fill it in with colorful bar graphs! With horizontal and vertical axes in place and grid lines for added support, this is a great resource for teaching children how to...
EngageNY
Solve for Unknown Angles—Angles and Lines at a Point
How do you solve for an unknown angle? In this sixth installment of a 36-part series, young mathematicians use concepts learned in middle school geometry to set up and solve linear equations to find angle measures.
CK-12 Foundation
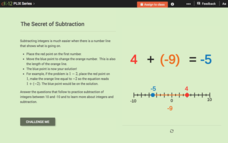
Properties of Real Number Addition: The Secret of Subtraction
Learners sometimes struggle to understand the concept of adding and subtracting integers. Help them see the why behind their answers using the interactive number line. The values change as individuals adjust the number line for each new...
Curated OER
NUMB3RS Activity: Where’s the Source? Episode: “Undercurrents”
Several real-world problems are posed as a way to learn about vector fields in order to make some predictions after analyzing the data. The main problem comes from the tv show NUMB3RS and is based on solving a crime where a body has...
Curated OER
Linear Equations
Eighth and ninth graders solve and graph 42 different problems that include writing various equations and graphing them on a grid. First, they create a table for each equation and graph it on a grid locating the x-and y-intercepts. Then,...
College Preparatory Mathematics
Using Elimination To Find the Point of Intersection of Two Lines
Two example problems are solved on the first page using the elimination method with a pair of linear equations. Detailed explanations accompany the math. The second page provides 20 practice problems and their answers. This would be a...
Curated OER
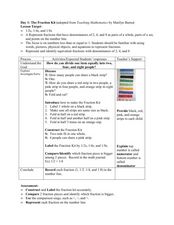
The Fraction Kit (2, 4, 8)
Construct a fraction kit with your elementary classes. Each learner will get various strips of colored paper. As a class, they fold the different colors into different sizes to recognize that each represents a different fraction. When...
Curated OER
Identifying Different Types of Graphs
This is an outstanding presentation on graphs and statistics. Learners choose which type of graph is being shown, and also gain practice in the techniques used to find the mean, median, and mode of sets of numbers. Very good!
Curated OER
Bar Graphs
Introduce scholars to bar graphs and data analysis through analyzing these visual examples. First, they look at a pictograph of fruit types and answer five observation questions. There is one done for them as an example. Learners do the...
Illustrative Mathematics
Who Has the Best Job?
Making money is important to teenagers. It is up to your apprentices to determine how much two wage earners make with their after school jobs. Participants work with a table, an equation, and a graph and compare the two workers to see...
Illustrative Mathematics
Electoral College
A cross-curricular resource that takes the electoral votes and allows your learners to organize and analyze the data. Young voters can determine which states are more influential and interpret the dotplot provided for more data....
Illustrative Mathematics
Puzzle Times
Give your mathematicians this set of data and have them create a dot plot, then find mean and median. They are asked to question the values of the mean and median and decide why they are not equal. Have learners write their answers or...
California Academy of Science
California's Climate
The United States is a large country with many different climates. Graph and analyze temperature and rainfall data for Sacramento and Washington DC as you teach your class about the characteristics of Mediterranean climates. Discuss the...
Alcohol Education Trust
Talk About Alcohol: What is BAC (Blood Alcohol Concentration)?
Educate your class about blood alcohol levels by combining health with math practice. Class members read a little bit about blood alcohol concentration and then solve some problems related to determining alcohol levels and alcohol...
Kuta Software
One-Step Inequalities
Here's a simple worksheet on solving and graphing inequalities for your algebra class. Learners solve 24 questions, graphing each on a number line. Numbers include fractions, integers, and negative numbers.
K-5 Math Teaching Resources
Large 5x5 Geoboard Paper
Accompany a physical Geoboard or use this printed 5x5 Geoboard paper with lines for writing to explore and explain basic geometric concepts.
K-5 Math Teaching Resources
5x5 Geoboard Paper
Geoboards can take up a lot of space in the classroom; instead use this 5x5 geoboard paper! Six geoboards and lines for writing are included in this multi-use printable and template.
EngageNY
Writing and Graphing Inequalities in Real-World Problems
Inequalities: when one solution just doesn't suffice. Individuals learn to write inequalities in real-world contexts and graph solution sets on the number line. All inequalities in the lesson are of the form x < c or x < c.
CK-12 Foundation
Order Real Numbers: Pie Baking Contest
Time is on your side. Scholars plot three points on number lines with different time units to represent the time it takes three people to bake pies. They determine the fastest baker and the difference in times between the bakers.
Mathed Up!
Bearings
Keep the math straight and true. Using information learned about angle relationships, pupils determine drawn bearings, or draw a line with a given bearing. The accompanying video provides the definition of a bearing and its three...
EngageNY
Grade 5 Math Module 1, Topic C, Lesson 7
Step up or step down to rounding. Using a vertical number line, the instructional activity shows pupils the significance of rounding up or rounding down. Teachers encourage scholars to write the number in unit form and decide which form...
Radford University
Triangular Irrigation
Try to keep the pipe short. Learners investigate where to place a water pump to use the least amount of pipe. Scholars use their knowledge of reflections and congruent triangles to find the best location for the water pump. Finally, they...
Other popular searches
- Number Line
- Line Graphs
- Parallel Lines
- Linear Equations
- Geometry Lines
- Linear Measurement
- Line Symmetry
- Line Plots
- Lines of Symmetry
- Line Segments
- Assembly Line
- Graphing Linear Equations


