Curated OER
Isolines on a Weather Map
Ninth graders recognize isolines on a weather map and draw isolines based on temperature data on a weather map. They draw isotherms on a weather map to identify temperature patterns.
Curated OER
Weather Map
Ninth graders utilize several different types of maps to forecast weather conditions specific areas of the country. Air masses, wind, cloud types, fronts, and the pH of the rain is explored in this lesson.
Prince William Network
Migration Math Madness
A great way to incorporate math into life science, this lesson has learners measure migratory routes on a map and calculate the actual distance that shorebirds on the routes would cover. Learners compute the distance covered in both...
Curated OER
Mapping a Temperature Field
Pupils measure and graph temperatures. For this temperature field lesson students use a map to measure and plot field values and construct isolines and interpret the results.
Curated OER
Isolines on a Weather Map
Ninth graders explore weather by analyzing maps. In this temperature activity, 9th graders view black and white weather maps of locations in which the weather changes often. Students identify the isolines used on the maps and utilize the...
Curated OER
Isotherms and Fronts
In this weather activity, students draw in isotherms on a temperature map. Students indicate the location of cold fronts, warm fronts, and stationary fronts. This activity has 2 drawing questions.
Curated OER
Forecasting Weather
In this weather worksheet, students use a weather map to determine which station has the lowest and highest pressure. Then they describe the various types of fronts that can come through a location. Students also explain the difference...
Curated OER
Weather Review
In this weather worksheet, students reviews terms associated with measuring different weather phenomena plus draw examples of different types of fronts on a weather map. This worksheet has 5 true or false, 15 matching, 21 multiple...
Curated OER
Weather Forecasting Basics
Eighth graders analyze weather diagrams and weather maps. In this earth science instructional activity, 8th graders explain why it is important to know the weather. They complete a handout at the end of the instructional activity.
Curated OER
Air Masses & Fronts
Young scholars use a set of maps depicting a front passing through the state to identify two distinct air masses and the frontal boundary. They then deterine whether the front is moving in time and in what direction the front is moving.
Polar Bears International
Top of the World
Learn about polar bears and the Arctic circle with a instructional activity about the countries and conditions of the region. After examining how the area differs from Antarctica, kids explore climates, animals, and geographical position...
Curated OER
Weather Analysis - Lab Activity
Ninth graders perform research in the subject of weather to answer several key questions to increase comprehension of concepts. Students use weather prediction as an application for the research.
Curated OER
Air Masses & Fronts
Students identify two distinct air masses and the frontal boundary and determine whether the front is moving in time and in what direction the front is moving.
Curated OER
Introduction to Drawing Isopleths
Learners draw isopleths based on how many pieces of "confetti snow" land in their cup.
Curated OER
Barnet Atmosphere Adv Word Search Puzzle
In this science and language arts learning exercise, students analyze 30 words in a word bank which pertain to the atmosphere and weather. Students find the words in a word search. The meaning of the title is unclear.
CK-12 Foundation
Ck 12: Earth Science: Weather Maps
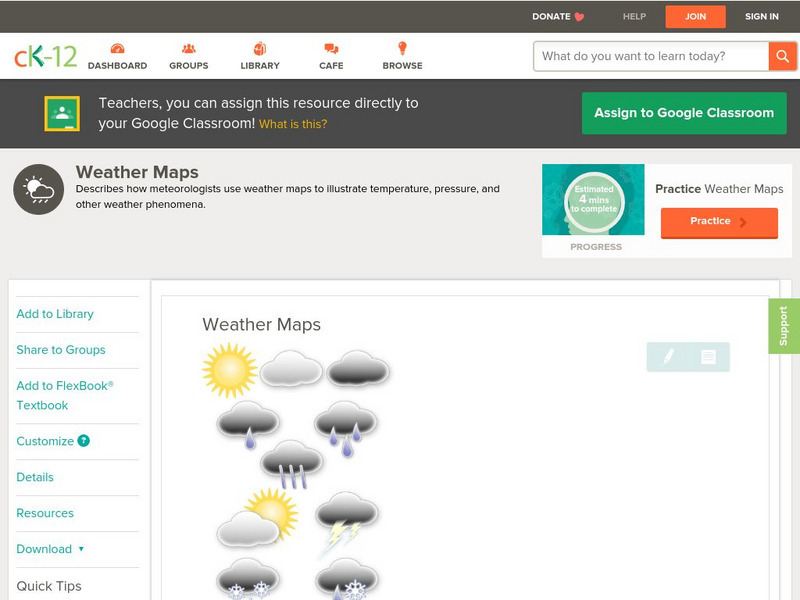
[Free Registration/Login may be required to access all resource tools.] How meteorologists create and read weather maps.
Curated OER
Educational Technology Clearinghouse: Maps Etc: Isothermal Map of Europe, 1916
An isothermal map of Europe from 1916 showing the average temperature ranges on the continent, illustrating how the westerly winds bring the temperatures of the ocean far inland. The isotherms show lines of equal temperature in degrees...
Curated OER
Etc: Maps Etc: Physical Asia With Isotherms, 1916
A map from 1916 of Asia, showing physical features, general elevations, and mean isotherms for January and July. This map uses color-contours to show land elevations ranging from below sea level around the Caspian Sea to over 12000 feet,...
Curated OER
Educational Technology Clearinghouse: Maps Etc: Asia (Physical), 1868
A map from 1868 of Asia showing physical features and natural resources of the region. The map shows political boundaries of the time, with capitals, major cities, and ports. The map shows mountain systems with black lines of variable...
Curated OER
Etc: Maps Etc: Physical Features of Europe, 1901
A map from 1901 of Europe, showing the physical features of the region. This map is color-coded to show general elevations from sea level to over 6,500 feet, mountain systems, drainage divides, lakes, rivers, coastal features, and the...
Curated OER
Educational Technology Clearinghouse: Maps Etc: North America, 1916
A map from 1916 of North America, Central America, Greenland, and the Caribbean to Puerto Rico showing land elevations, water depths, and isothermal lines of mean temperatures for January and July. The map uses color-contouring to show...
Curated OER
Mountains, Plains, Rivers, Isothermal Lines of the United States, 1873
A map from 1873 of the United States showing the physical features of mountain systems, plateaus, basins, plains, rivers, lakes, and coastal features, with elevations given for prominent peaks given in feet above sea level. The map is...
Curated OER
Etc: Maps Etc: Physical, Political, and Economic Asia, 1872
A map of Asia from 1872, showing physical features including mountain systems, deserts, lakes, rivers with direction of flow, coastal features, and ocean currents, political boundaries and foreign possessions at the time, and commercial...
Curated OER
Etc: Maps Etc: The Dominion of Canada and Newfoundland, 1902
A map from 1902 of the Dominion of Canada, showing provinces, province capitals and major cities, railroads, canals, mountain systems, lakes, rivers, and coastal features. Symbols on the map indicate the head of navigable rivers (anchor...


