Curated OER
Worksheet 12
In this math worksheet, students explain the vector parametric equation for a line, scalar parametric equations, symmetric equations, and the implicit equation for a line.
Curated OER
Data Analysis
In this data analysis worksheet, students solve and complete 4 different types of problems. First, they reduce the data provided to find the means, and graph the means in a line graph. Then, students graph the data from each mixture...
Curated OER
Discovering Advanced Algebra More Practice Your Skills, Lessons 11.1-11.6
In this six page series of learning exercise, students answer short answer questions about a variety of topics. The six topics covered in this packet are: Experimental Design (4 questions), Probability Distributions (3 multiple choice...
Curated OER
Find the Average Value of a Function
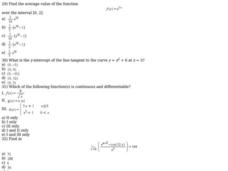
In this calculus worksheet, 11th graders calculate the average value of a function. They find the line tangent to a curve and graph the equation. There are 15 questions.
Curated OER
Average Value of a Function
In this calculus worksheet, 12th graders calculate the line tangent to a curve and find the average value of a function. There are 12 questions.
Curated OER
Plasmasphere
In this plasmasphere worksheet, students determine how long the plasmasphere takes to rotate around the Earth using two satellite images taken three hours apart.
Curated OER
Where Should You Turn?
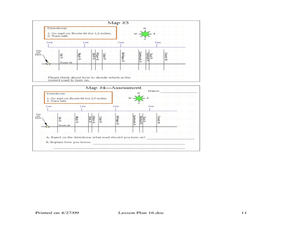
Fourth graders complete activities to study decimal numbers. In this decimal numbers lesson, 4th graders study decimal numbers to express numbers less than one and intervals. Students complete map and location activities to study the...
Curated OER
Rates Of Change
Students investigate the rate of change and how it effects a function over a given interval. They examine the slope of a line that is seccant and how it is compared to a tangent line and then determine the changes of a function at any...
Curated OER
Scrabble
In this frequency worksheet, students use the standard rules for Scrabble to find the abbreviations used on the board. Then, the determine the frequency as stated in the chart shown to represent the correct number of letter tiles.
Curated OER
River Width
Learners determine the level of accuracy needed for computations involving measurements and irrational numbers. They use the correct number of digits in computation to achieve an appropriate unit or level of accuracy when solving...
Curated OER
Foreign Stamps
Eighth graders convert the price of US stamps to those of a number of foreign currencies. They use conversion charts to make the changes.
Curated OER
What Time Is It? #2
In this telling time worksheet, students look at a set of 9 clocks and write the correct time shown on each on a line beneath each clock.
McGraw Hill
My Vocabulary Cards: Grade 4 Math
Practice your fourth grade math concepts with a series of flash cards. Covering topics such as place value, decimals, fractions, measurement, and many more, the flash cards can help learners of any level with their comprehension. The...
Curated OER
Cantor Set
Discover an interesting mathematical object that your algebra learners will enjoy investigating. Their adventure will lead them to the generation of a finite geometric series.
Curated OER
Jon and Charlie's Run
Let's use math to solve an argument. Jon and Charlie are debating about who can run farther, but who is right? That's what your class will figure out as they apply their understanding of fractions to this real-life situation. A simple,...
Houghton Mifflin Harcourt
Unit 3 Math Vocabulary Cards (Grade 3)
Looking for math vocabulary cards for third graders? Use a set of 15 math cards with terms associated with graphing. The top half of each sheet has the vocabulary word printed in bold text, and the bottom half includes the word's...
EngageNY
Creating a Dot Plot
Which dot am I? Pupils create dot plots to represent sample data through the use of frequency tables. The third segment in a series of 22 asks individuals to analyze the dot plots they created. The scholars translate back and forth...
Curated OER
Histograms
Young statisticians explore the concept of histograms. They construct histograms of various data such as change in a student's pocket, and guessing on a test. hHey analyze data represented as a histogram and a box plot and compare...
Curated OER
Expanded and Standard Form
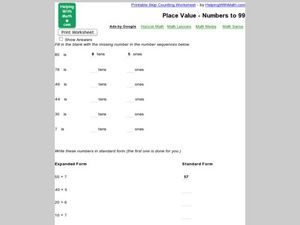
Tens and ones, that's what this worksheet is all about. Learners break down 6 numbers into their 10s and units, transpose 5 numbers from expanded to standard form, and write 5 numbers in word form. This would be a good worksheet to...
Curated OER
Numbers, Numbers Everywhere!
Explore properties of integers! In this algebra lesson, pupils add, subtract, divide and multiply using integers correctly. They differentiate between rational and irrational numbers.
Curated OER
Coordinating Coordinates
Third graders explore coordinate pairs and coordinate grids. They use a grid on which each letter of the alphabet is assigned a coordinate pair, 3rd graders decipher a coded message. Pupils compare coordinate pairs on a coordinate grid...
Curated OER
Factoring With Polynomials
In this algebra worksheet, students factor polynomials using the greatest common factor. They also use the foil method. There are 8 questions with an answer key.
Curated OER
Absolute Value
In this algebra worksheet, students solve absolute value equations through graphing and algebraically. There are 50 questions.
Curated OER
Exponential vs. Power
Pupils differentiate between exponential and power functions. They identify the base, exponent and properties of exponential functions. They also graph the functions using the TI calculator.


