EngageNY
Modeling a Context from a Verbal Description (part 1)
When complicated algebraic expressions are involved, it is sometimes easier to use a table or graph to model a context. The exercises in this lesson are designed for business applications and require complex algebraic...
West Contra Costa Unified School District
Introduction to Solving Linear Inequalities in One Variable
Life isn't fair ... like inequalities. After first reviewing inequality symbols and how to read inequality statements, learners discover how to solve one-step inequalities and graph their solution sets.
Curated OER
Using Data Analysis to Review Linear Functions
Using either data provided or data that has been collected, young mathematicians graph linear functions to best fit their scatterplot. They also analyze their data and make predicitons based on the data. This lesson is intended as a...
EngageNY
Modeling a Context from Data (part 2)
Forgive me, I regress. Building upon previous modeling activities, the class examines models using the regression function on a graphing calculator. They use the modeling process to interpret the context and to make predictions...
EngageNY
Normal Distributions (part 2)
From z-scores to probability. Learners put together the concepts from the previous lessons to determine the probability of a given range of outcomes. They make predictions and interpret them in the context of the problem.
Curated OER
Delivery Trucks
Written to assess learners' knowledge of interpreting expressions that represent a quantity in terms of its context, this machine-scored task also allows for a good discussion about units guiding the problem solving and solution.
Curated OER
Voter Turnout
Explore politics by analyzing the voting process. Pupils discuss the purpose of casting votes in an election, then examine graphs based on the data from a previously held election's turnout. The lesson concludes as they answer study...
Illustrative Mathematics
Writing Constraints
Use this resource to present your number crunchers with how to write a constraint equation and to determine viable solutions. The price of an object limits the amount that can be purchased. The speed at which you walk limits the number...
Illustrative Mathematics
Summer Swimming
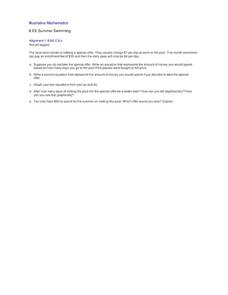
Here is a real-world application for systems of equations. When is it better to pay an enrollment fee and lower daily rate, and when is it better to pay the regular price? The local swim center is having a special offer, reductions in...
Curated OER
The Canoe Trip, Variation 1
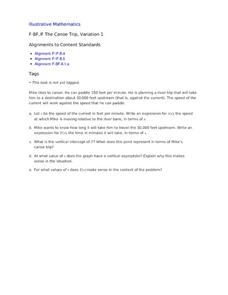
Your river sportsmen will explore an example of paddling upstream as they build functions modeling speed and time in terms of the speed of the current. They then use their algebraic models to interpret features of the function related to...
Curated OER
Systems of Linear Inequalities
Graphing systems of linear inequalities is the focus of this worksheet. Problems range from checking solutions of inequalities, graphing systems of two inequalities, and graphing systems of three inequalities. Graphing horizontal lines,...
Curated OER
Analyzing Graphs and Data
Students collect and analyze data. In this statistics lesson, students graph their data and make inferences from the collected data. They display their data using graphs, bar graphs, circles graphs and Venn diagrams.
Curated OER
Linear Systems: Graphical Interpretation of Vectors
In this graphical interpretation of vectors instructional activity, students execute operations of addition and multiplication by a scalar. They sketch results and determine the commutativity of vector addition. This three-page...
Curated OER
Algebra: Reaching New Heights
Students work in pairs to measure their arm span and height and record them on a class chart. The class works together to create a scattergram to display the data. Class discussion focuses on interpreting the scattergram.
Curated OER
Chart Your Course
Students explore change represented in graphs comparing distance and time. They exchange and share their graphs. Students interpret and create distance versus time line-graphs, and write stories based on these graphs. They interpret a...
Curated OER
Data Analysis and Probability
Students make their own puzzle grid that illustrates the number of sit-ups students in a gym class did in one minute, then they make a histogram for this same data. Then they title their graph and label the scales and axes and graph the...
Curated OER
What's My Pattern?
Students recognize, describe and extend patterns in three activities. They organize data, find patterns and describe the rule for the pattern as well as use the graphing calculator to graph the data to make and test predictions. In the...
Inside Mathematics
Coffee
There are many ways to correlate coffee to life, but in this case a worksheet looks at the price of two different sizes of coffee. It requires interpreting a graph with two unknown variables, in this case the price, and solving for...
5280 Math
More or Less the Same
Tell the story of the math. Given a graph of a linear system, learners write a story that models the graph before crafting the corresponding functions. Graphs intersect at an estimated point, allowing for different variations in the...
Curated OER
Bouncing Ball
Students collect height versus time data of a bouncing ball using the CBR 2™ data collection device. Using a quadratic equation they graph scatter plots, graph and interpret a quadratic function, apply the vertex form of a quadratic...
Mathematics Vision Project
Module 3: Features of Functions
Learn how to represent functions in multiple ways. Learners analyze functions as equations, graphs, and verbal descriptions. The analysis includes intercepts, behavior, domain, and range. The module of seven lessons makes up the third...
Curated OER
Narrow Corridor
Buying a new sofa? Learn how to use the Pythagorean Theorem, as well as algebra and graphing techniques, to determine whether the sofa will fit around a corner (which I'm sure you'll agree is a very important consideration!).
Curated OER
Linear Regression and Correlation
Learners explore scatter plots. In this linear regression lesson, groups of pupils graph scatter plots and then find the line of best fit. They identify outliers and explain the correlation. Each group summarizes and shares their...
Ohio Department of Education
I Can Do This! Systems of Equations
Use tables, graphs, and substitution to solve systems of linear equations. An envelope of sample problems is passed around the classroom, and each learner has the opportunity to solve the system in the envelope. This is a great way to...


