Alabama Learning Exchange
The State Capital of Stem and Leaf
Students explore the concept of stem and leaf plots. In this stem and leaf plots lesson, students plot the 50 US states' capitals on a stem and leaf plot according to the first letter of each state. Students compare their stem and leaf...
Curated OER
My Peanut Butter is Better Than Yours!
Learners explore the concept of statistical data. In this statistical data instructional activity, students read an article about the dangers of peanut butter to those who are allergic. Learners perform a taste test of two different...
Curated OER
Student Heights
Students measure the heights of their fellow classmates and create a box and whisker plot to display the data. In this measurement lesson plan, students analyze the data and record results.
Curated OER
Checking County Numbers
Students use their county's information page to gather information about their community. Using the information, they create graphs from the tables provided and interpret the data. They write a paragraph showing their interpretation of...
Curated OER
Measuring the Speed of a Wave
Students create an experiment in which they measure the speed of a wave and record the data in a graph. They work in small groups to write the procedure for the experiment and share it with another group for cross checking of the...
Curated OER
The Great Chile Challenge
Fifth graders gather data, create a graph, and interpret information. They build vocabulary by negotiating the ideas that go into the graphs which they create. They use Excel to print a variety of graphs based on how much they like Chile...
Curated OER
What's Your Favorite Stuffed Animal?
Second graders gather information in a survey and interpret the results using a tally chart, a table, and a bar graph. They' present their results of the during the final group discussion. The subject of the survey is favorite stuffed...
Curated OER
The Stock Exchange Phase I
Second graders select a stock and follow its ups and downs, using graphs to show its success.
Curated OER
A Real Difference
Fifth graders use the Celsius and Fahrenheit thermometers to compare temperature readings. They use the Internet to find the temperatures of selected cities. After data is collected for five days, 5th graders graph the temperatures.
Curated OER
Box Plots on the TI-83 Calculator
Eighth graders research box plots on the Internet. They gather real life statistics and analyze the collected statistics by making multiple box plots on the TI-83 calculator.
Curated OER
Double, Double: Looking at the Effect of Change on Perimeter, Area and Volume
Students explore perimeter, volume, and area. In this math lesson, students explore how changes in dimensions of geometric shapes affect the perimeter, area and volume of the various shapes. Students investigate the results when the...
Curated OER
Environmental Mathematics
Eighth graders determine food that they would need to survive in the wild. They graph the best foods for their environments and rate the survivability rate for each member of their group.
Curated OER
The Cost of Life
Students research the salary for a career of interest. They consider what kind of lifestyle that career would provide and graph their information for comparison.
Curated OER
Home on the Biome
Fifth graders study six major biomes, graph temperature and rainfall, and present their findings to the class.
Curated OER
Absolute Value of Linear Functions
Students identify and interpret how absolute value affects linear functions. They also graph linear functions and reflect them in a line of symmetry. Finally, students evaluate the absolute value of a constant using technology to...
Curated OER
Survey Project
Eighth graders create a website using FrontPage. They use inserted forms to collect survey information and use Microsoft Excel and MS Word to create a presentation of the survey and the results.
Curated OER
Cars on the Curve
Second graders, using two dice, participate in a car race game called Cars on the Curve. They predict which car wins the game and records it in their Data Diary.
Curated OER
Venn Diagram and UK Basketball
Students analyze data and make inferences. In this algebra activity, students collect and analyze data as they apply it to the real world.
Curated OER
Lessons for Atlatl Users with Some Experience-Grade 6
Sixth graders experiment with an atlatl and dart. In this sixth grade data management mathematics lesson, 6th graders explore and determine the most suitable methods of displaying data collected from their experimentation with throwing...
Curated OER
Statistics with State Names
Students analyze the number of times each letter in the alphabet is used in the names of the states. For this statistics lesson, students create a stem and leaf plot, box and whisker plot and a histogram to analyze their data.
EngageNY
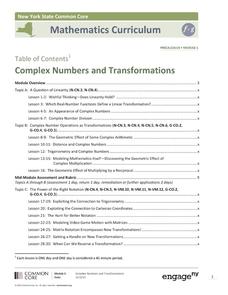
Complex Numbers and Transformations
Your learners combine their knowledge of real and imaginary numbers and matrices in an activity containing thirty lessons, two assessments (mid-module and end module), and their corresponding rubrics. Centered on complex numbers and...
Curated OER
As the Wheel Turns
This is not your typical Ferris wheel problem. In this exercise, your class will combine their knowledge of sinusoidal functions as well as linear motion to come up with parametric equations that model the position of a point on the edge...
Curated OER
What on Earth is Greater Than?
Students compare things that are greater than, less than, or equal to, compare the Earth to other planets, and list planets from greatest size to smallest size.
Curated OER
Box-and-Whisker
Seventh graders are introduced to the concept of box-and-whisker plots. A step-by-step process for creating a box-and-whisker plot is provided. The goal of the lesson is that students study the components of a box-and-whisker plot and be...


