Curated OER
Survey Says...
Young learners create and implement a school-wide survey about student body favorites! Learners record and analyze the data on a bar graph, picture graph, and line graph, and then display the data. Then, wrap it all up with a celebration...
Curated OER
Curious Clouds
Second graders explore clouds. They read The Cloud Book by Tomie dePola. Students sort the cloud pictures into three categories. Students create a graph using the cloud pictures. They use Excel to create a bar graph.
Curated OER
Play It
There are a number of activities here that look at representing data in different ways. One activity, has young data analysts conduct a class survey regarding a new radio station, summarize a data set, and use central tendencies to...
Curated OER
The Hudson's Ups and Downs
Even rivers have tides. Older elementary schoolers will discuss the Hudson River and how weather, water craft, and the ocean cause tidal fluctuation. They will examine a series of line graphs that depict tidal fluctuation, then analyze...
Curated OER
7th Grade Math Worksheet
For this integers worksheet, 7th graders solve 10 different problems that include various types of integers and graphs. First, they determine the sum of 3 consecutive integers. Then, students find the ratio between 2 areas of similar...
Curated OER
Making Logic Out of Madness
Tenth graders organize and interpret data from a student health program. In this physical education lesson, 10th graders use a body composition analyzer over 8 weeks to determine the validity of a student health program. ...
Curated OER
To stretch or not to stretch
Hands-on is the best way to play. Learners read a graph that shows the force needed to stretch a rubber band. They do this and then participate in a simple experiment where they create coiled springs with wire. They work to determine how...
Curated OER
Stories to Graphs: Practice A
Ninth graders interpret graphs. In this Algebra I lesson, 9th graders examine graphs as an interpretation of a story. Students match graphs to story problems and create their own graphs given a story situation.
Chicago Botanic Garden
Historical Climate Cycles
What better way to make predictions about future weather and climate patterns than with actual climate data from the past? Young climatologists analyze data from 400,000 to 10,000 years ago to determine if climate has changed over...
Curated OER
Data Analysis Using Technology
Analyze data using technology. Middle schoolers design data investigations, describe data, and draw their own conclusions. Then they select the best type of graph, graph and interpret the data, and look for patterns in trends. They also...
NTTI
Line 'Em Up!
Coordinate planes and Cartesian graphing systems are the focus of this math lesson. Learners use video, internet activities, and engage in hands-on activities in order to explore coordinate planes. The materials needed for this lesson...
Yummy Math
Diapers
Most of your students probably think a car or college is the first big expense their parents could help them with, but as it turns out these kids have been costing their parents for their whole lives. Have they ever considered how much...
Chicago Botanic Garden
Historical Climate Cycles
Scientists use ice core samples to obtain temperatures of the earth from 400,000 years ago! The third of five lessons instructs pupils to interpret historical climate data to see changes over time. In part I, participants interpret...
Shodor Education Foundation
InteGreat
Hands-on investigation of Riemann sums becomes possible without intensive arithmetic gymnastics with this interactive lesson plan. Learners manipulate online graphing tools to develop and test theories about right, left, and...
NASA
The Big Climate Change Experiment Lesson 3: Climate Change Lines of Evidence
Consider the preponderance of evidence when making a verdict. The third of five lessons in Unit 1: The Big Climate Change Experiment focuses on the evidence for climate change. Learners study graphs, diagrams, and pictures regarding...
Willow Tree
Histograms and Venn Diagrams
There are many different options for graphing data, which can be overwhelming even for experienced mathematcians. This time, the focus is on histograms and Venn diagrams that highlight the frequency of a range of data and overlap of...
University of Colorado
Solving a Mixed Up Problem
Begin the process of adding and subtracting spectra. Having a basic understanding of occultation events, pupils begin the pursuit to determine what a found atmosphere might contain. Learners work with two graphs and calculate what the...
Shodor Education Foundation
Plop It!
Build upon and stack up data to get the complete picture. Using the applet, pupils build bar graphs. As the bar graph builds, the interactive graphically displays the mean, median, and mode. Learners finish by exploring the changes in...
CK-12 Foundation
Intercepts by Substitution: Finding a Linear Product Using a Quadratic
Discover another way to interpret multiplication. Using an interactive, learners slide points (representing the factors of multiplication) along the x-axis of the graph of y = x^2 and observe changes in the line segment connecting the...
Mathed Up!
Pie Charts
Representing data is as easy as pie. Class members construct pie charts given a frequency table. Individuals then determine the size of the angles needed for each sector and interpret the size of sectors within the context of frequency....
Curated OER
Graphs: Scatter Graph
In this scatter graph learning exercise, students read and interpret given scatter graphs. They plot ordered pairs and write numbers from least to greatest. This fourteen learning exercise contains approximately 18 problems. Some answers...
Curated OER
Use Graphs
In this math graphs worksheet, students use the talent show graph to help them find the answer for the problems. Students write number sentences for the last four problems.
Curated OER
Professor Panda's Pizza Graph
In this data analysis learning exercise, students answer 11 questions using a bar graph that was constructed from the answers to a survey about pizza toppings. They use a secret code to determine the best place to have a pizza.
Curated OER
Graphs and Pictograms
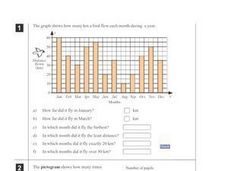
In this graphs and pictograms learning exercise, students analyze both a graph and a pictogram and then answer 11 questions about them. Students can click on the Check button to determine whether their answers are correct or not.
Other popular searches
- Interpret Graphs and Charts
- Read and Interpret Graphs
- Graphs Interpret
- Interpret Graphs Science
- Interpret Graphs and Data
- Use and Interpret Graphs
- Interpret Graphs and Science
- Algebra Interpret Graphs
- Graphs Interpret Plot


