Curated OER
Using Matrices to Enter Data and Perform Operations
Here's a TI step by step guided lesson on matrices. The class enters data into the TI calculator about movie ticket sales and uses matrices as a problem solving tool. They add and multiply matrices to determine profit.
Curated OER
Many Ways to Represent Our Data
Demonstrate several ways to represent data with your class. They will use surveys to gather data and display the data using tally charts and graphs. Then answer questions according to the data.
Earth Watch Institute
Entering Local Groundhog Data in an Excel Spreadsheet
Here is a cross-curricular ecology and technology lesson; your learners create spreadsheets depicting the location and number of groundhog dens in a local park. They research groundhogs and analyze data about where the groundhog...
Curated OER
Reading Primary Source Documents: Historical Content
Why do we read primary source documents? What can they give us that other writings cannot? Provide your learners with any of the primary sources attached here (there are seven), and have them complete the graphic organizer (which opens...
Curated OER
Data Analysis Challenge
In this data analysis worksheet, young scholars work with a partner to collect information for a survey. The information is then compiled into a graph. Students must indicate their survey question, the target audience, predict the...
Curated OER
Show Me The Data!
Pupils create a bar graph. They will collect and organize data to turn into bar graphs. They create graphs for the favorite sports of the class, color of M&M's, and types of cars passing by.
DK Publishing
Using Information in Tables
Find out how well can your second or third graders use tables to solve word problems by assigning this single-page worksheet. Two tables with different sets of data prompt learners to solve six problems. An example at the top of the page...
Howard Hughes Medical Institute
Gorongosa: Scientific Inquiry and Data Analysis
How does the scientific process begin? Introduce ecology scholars to scientific inquiry through an insightful, data-driven lesson. Partners examine data from an ongoing research study to determine the questions it answers. The resource...
Curated OER
Data Analysis
Young statisticians use and interpret measures of center and spread such as mean, median, and mode as well as range. They use box plots to represent their data and answer questions regarding the correspondence between data sets and the...
Curated OER
Focus on Economic Data: US Real GDP Growth, August 26, 2011
Young economists answer a series of critical thinking questions as they analyze real data that shows GDP Growth. They examine the provided charts, read through the background information, and discuss changes that occurred in the third...
Curated OER
Worksheet for Analysis of a Letter
Dear Nancy, how do you analyze a letter? Love, Trez. Dear Trez, you use a Letter Analysis Worksheet. Love, Nancy.
This richly detailed worksheet provides multiple questions that lead researchers step-by-step through the process of...
Curated OER
Document Analysis Sheet
Sometimes all kids need is a little guided practice and then they can be on their way. They can use an analysis worksheet to help them analyze a primary or secondary source document. They answer several questions describing the type of...
Curated OER
Matrix Analysis of Networks
Explore the connection between a finite graph, a directed graph, and a matrix. Graph lines and identify the relationship of matrices in real-world scenarios. Then use this information to work with a partner to plan and design a town...
Curated OER
Applications of GIS
Don't be concerned that the title slide of this presentation mentions Virginia's Geospatial Extension Program; this slide show is very informative for any technology-focused curriculum when considering global information systems. It...
Livaudais-Baker English Classroom
Literacy Analysis for Lord of the Flies
Here's an assignment sheet that models for readers how to craft a literary analysis of William Golding's Lord of the Flies. The packet includes a graphic organizer, a model outline, a model essay, and a detailed rubric.
NOAA
Ground-truthing Satellite Imagery with Drifting Buoy Data
Ground-truthing ... is it even a word? The last installment of a five-part series analyzes how scientists collect sea surface temperature data. Scholars use government websites to compare temperature data collected directly from buoys...
EngageNY
Qualities of a Strong Literary Analysis Essay
Read like a writer. Scholars read a model literary analysis in preparation for a similar writing assignment before annotating each paragraph for the gist. Next, pupils devise a list of qualities of a strong literary analysis essay.
Code.org
Making Data Visualizations
Relax ... now visualize the data. Introduce pupils to creating charts from a single data set. Using chart tools included in spreadsheet programs class members create data visualizations that display data. The activity encourages...
Brigham Young University
Introducing the Text and Learning the Process of Script Analysis
Where do directors and set designers get their ideas so that the set they build creates the mood and atmosphere the director wants for a production? From the script! Introduce theater high schoolers to the script analysis techniques used...
EngageNY
Summarizing a Data Distribution by Describing Center, Variability, and Shape
Put those numbers to work by completing a statistical study! Pupils finish the last two steps in a statistical study by summarizing data with displays and numerical summaries. Individuals use the summaries to answer the statistical...
Statistics Education Web
First Day Statistics Activity—Grouping Qualitative Data
Making groups of groups can help to organize data. Classes use statistics to group themselves using descriptive adjectives. The objective is for learners to understand that grouping qualitative data is useful when the original groups are...
Teach Engineering
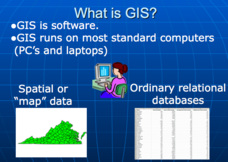
What is GIS?
Is GIS the real manifestation of Harry Potter's Marauders Map? Introduce your class to the history of geographic information systems (GIS), the technology that allows for easy use of spatial information, with a resource that teaches...
EngageNY
Variability in a Data Distribution
Scholars investigate the spread of associated data sets by comparing the data sets to determine which has a greater variability. Individuals then interpret the mean as the typical value based upon the variability.
EngageNY
Analyzing a Data Set
Through discussions and journaling, classmates determine methods to associate types of functions with data presented in a table. Small groups then work with examples and exercises to refine their methods and find functions that work to...


