Curated OER
Exploring Slope
For this exploring slope worksheet, students solve and complete 4 different problems. First, they compare an object's weight on Earth to an object's weight on another planet using the information given. Then, students compare this...
BW Walch
Creating and Graphing Linear Equations in Two Variables
This detailed presentation starts with a review of using key components to graph a line. It then quickly moves into new territory of taking these important parts and teasing them out of a word problem. Special care is...
Ohio Literacy Resource Center
Solving Systems of Linear Equations Graphing
Do you need to graph lines to see the point? A thorough lesson plan provides comprehensive instruction focused on solving systems of equations by graphing. Resources include guided practice worksheet, skill practice worksheet,...
TryEngineering
Sugar Crystal Challenge
Be sure to use this sweet resource. Scholars perform an experiment using sugar to investigate how surface area relates to the coarseness of sugar. They consider how this concept connects to nanotechnology.
Curated OER
Podcasting Parabolas
Students explore parabolas. In this algebra and technology lesson, students construct the equation of a specific parabola, then take digital photos of real-life representations of these parabolas. Students create a podcast...
Curated OER
Discovering the Linear Relationship between Celsius and Fahrenheit
Learners discover the linear relationship between degrees Farenheit and degrees Celsius. They manually compute the slope and y-intercept of the line passing through points. They convert Celsius to Fahrenheit degrees.
Curated OER
Two Variable Linear Equations
Everything you need to teach a lesson on two variable linear equations is right here. Objective, vocabulary, tech tips videos, and multiple downloadable files are all included. Learners will use the TI-Nspire technology to determine the...
Kenan Fellows
Let's Move
Find a statistical reason for a fresh start. Using a hypothetical scenario, individuals research statistical data of three different cities. Their goal? Find the best statistical reason for a business to move to a new location. Their...
Curated OER
Cockroach Slope
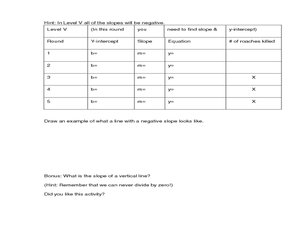
Students identify the slope of linear functions. In this slope lesson, students collect data and graph it. They write equations with no more than two variables and use technology to explain their data.
Mathematics Vision Project
Module 7: Modeling with Functions
The sky's the limit of what you create when combining functions! The module begins with a review of transformations of parent functions and then moves to combining different function types using addition, subtraction, and...
Curated OER
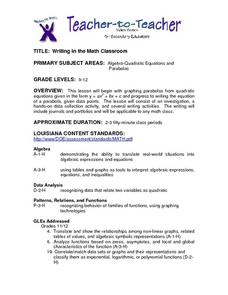
Writing in the Math Classroom
Students determine the vertex, y-intercept and direction of a parabola and write an explanation of how to graph a parabola. They collect and graph data using a calculator.
Curated OER
Slopey Math
Students identify the slope of a line and use it to solve real life problems. In this algebra lesson, students write linear equations in slope intercept form and make a correlation to its relation to the real world. They use the slope an...
Curated OER
Real-World Linear Equations
Eighth graders practice technology skills through the use of a spreadsheet and a discovery lesson plan focusing upon linear equations. The technology allows for the visual changes to be displayed for different lines of equations.
Curated OER
Translating Parabolas
Students make informed choices among technology systems, resources, and services. They select and apply technology tools for research, information analysis, problem solving, and decision making in content learning.
Curated OER
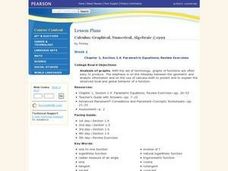
Calculus: Graphical, Numerical, Algebraic
Students explore the interplay between the geometric and analytic information and on the use of calculus both to predict and to explain the observed local and global behavior of a function. They write a paragraph describing any...
Curated OER
Calculus
Young scholars make an inquiry with the aid of technology into the concept of functions. The emphasis of the lesson plan is on the interplay between the geometric and analytic information.
Mathematics Vision Project
Module 6: Congruence, Construction, and Proof
Trace the links between a variety of math concepts in this far-reaching unit. Ideas that seem very different on the outset (like the distance formula and rigid transformations) come together in very natural and logical ways. This...
Curriculum Corner
8th Grade Math Common Core Checklist
Ensure your eighth graders get the most out of their math education with this series of Common Core checklists. Rewriting each standard as an "I can" statement, this resource helps teachers keep a record of when each standard was...
Curated OER
Student Exploration: Fraction, Decimal, Percent
Students explore the concept of fractions, decimals, and percents. In this number sense lesson, students use a worksheet to guide them through the exploration of the relationship between fractions, decimals, and percents. ...
Curated OER
Which Method Will You Choose? Finding Solutions to Systems of Equations.
Ninth graders investigate systems of linear equations. For this Algebra I lesson, 9th graders determine which method is the best for solving a systems: graphing, substitution, or elimination. Students choose...
Curated OER
Paying College Tuition
The investigation of exponential equation in the context of increasing college tuition costs is explored through this lessib. Students write exponential equations based on the percent of change of college tuition and use their...
Curated OER
Investigating Transformations Of Parent Functions
Students identify the basic transformations of parent functions. They use their graphing calculator to create a transformation booklet by folding a sheet of computer paper in half and stapling along the folded edge.
Curated OER
Can you Find the Expression
Pupils collect data from measurements and weights for this experiment. In this algebra lesson, students analyze graphs they create form their data to find the expression representing the data. They label which graph provided the best...
Curated OER
Creating Line Graphs
Young scholars relate data to coordinate graphs and plot points on this graph. They use minimum wage data to construct the graph. Students decide appropriate time intervals for the graphs. They share graphs with their classmates.


