Curated OER
Health Education: An integrated Approach; Exit Drills in the Home
Third graders learn about fire safety in the home in order to plan escape routes while avoiding smoke inhalation. In this fire safety lesson plan, 3rd graders first discuss a smoke detector and its purpose, and then discover the...
Curated OER
A Solar Project
Students make predictions about the global temperature of the earth and to see how this is dependent upon a number of variables. Students visualize how changing parameters can impact the global temperature of the earth.
Curated OER
Beans and Birds: A Natural Selection Simulation
Students examine the problem concerning the evolution of seed color in pinto bean plants "How does natural selection change the frequency of genes or traits over many generations"? Students work in teams to design an experiment that...
Better Lesson
Better Lesson: Graphing Inequalities on a Number Line
Sixth graders graph the solutions of inequality on a number line and explain the solutions.
Other
Nearpod: Inequalities in One Variable
In this lesson, 7th graders will learn how to write and graph inequalities to represent real-life situations.
Other
Nearpod: Two Variable Inequalities
In this instructional activity, learners will graph linear inequalities and determine the solution set.
Better Lesson
Better Lesson: Inequalities
If a < b, what do we know about a and b? If b < c < d, how could we show that on a number line? Students continue creating inequalities and graphs to represent situations.
Illustrative Mathematics
Illustrative Mathematics: A ced.a.2 and a ced.a.3: How Much Folate?
This task is designed to be used as an introduction to writing and graphing linear inequalities. Aligns with A-CED.A.2 and A-CED.A.3.
Illustrative Mathematics
Illustrative Mathematics: F if Identifying Graphs of Functions
For this task, learners are presented with four function equations and four graphs of functions showing -2 less than or equal to x, which is less than or equal to +2. They are asked to match each function to the corresponding graph and...
Alabama Learning Exchange
Alex: Graphing Is Great!
Learners will explore graphing individually and in groups. They will also use an interactive activity to discuss slope and intercepts. To assess the instructional activity, students will use the floor tiles in the classroom as a large...
Illustrative Mathematics
Illustrative Mathematics: F Le What Functions Do Two Graph Points Determine?
In this task, students find a unique linear function, a unique exponential function, and more than one quadratic function that go through the same two points on the coordinate grid. Aligns with F-LE.A.
Alabama Learning Exchange
Alex: Focusing on Graphs
For this lesson, young scholars will solve systems of linear equations by graphing. Systems of linear equations are two or more linear equations together.
Illustrative Mathematics
Illustrative Mathematics: A Rei Solution Sets
For this task, students are shown the graphs of two equations, with areas bounded by their lines and intersections shaded in different colors. They are asked to write a system of equations or inequalities for each shaded area and explain...
TeachEngineering
Teach Engineering: Floaters and Sinkers
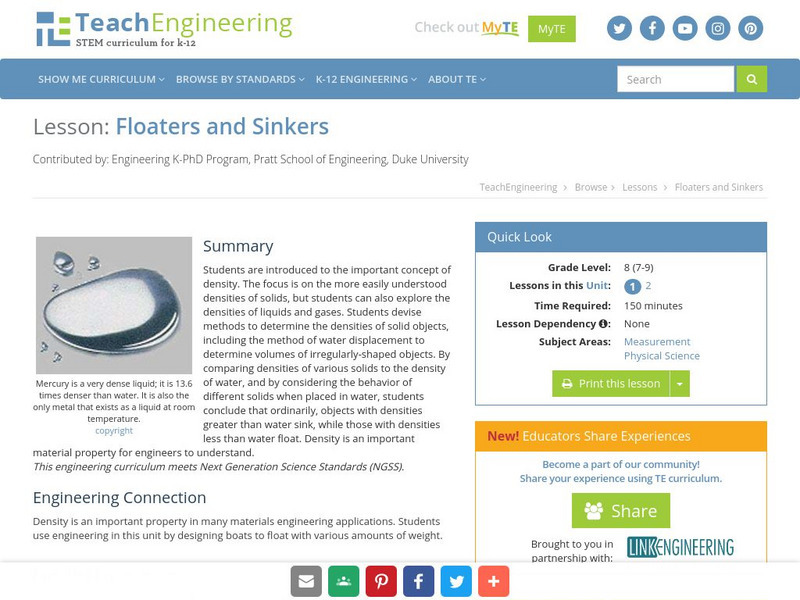
This lesson introduces students to the important concept of density. The focus is on the more easily understood densities of solids, but students can also explore the densities of liquids and gases. Students devise methods to determine...
Alabama Learning Exchange
Alex: Which Way Do I Go, George, Which Way Do I Go?
This lesson will explore the process of graphing inequalities on a number line. It will also explore writing an inequality when given a graph. This lesson plan was created by exemplary Alabama Math Teachers through the AMSTI project.
Alabama Learning Exchange
Alex: Human Slope
Students will participate in this discovery activity intended for them to uncover the role each variable plays in the graph of a line in the form y = mx + b. Students will actually demonstrate lines in slope intercept form on a life size...
Better Lesson
Better Lesson: Working Out the Solutions
A lesson for students to work with writing and graphing inequalities. Documents to execute the lesson are included.
Alabama Learning Exchange
Alex: When Will Mr. "X" Meet Miss "Y"?
During this lesson, students will solve systems of equations graphically. Students will graph various equations individually using graphing paper. They will work with a partner to solve several system of equation problems and then graph...
Alabama Learning Exchange
Alex: A Piece of Pi
This lesson uses graphing to help students understand that pi is a constant and is the slope of the line graphed on a circumference vs. diameter graph.This lesson plan was created as a result of the Girls Engaged in Math and Science...
Alabama Learning Exchange
Alex: Finding the Slope of a Line
This lesson will use a slide presentation to facilitate teaching students how to find the slope of a line when given the graph of the line or two points. Students will interact with the presentation in two ways: first, by taking notes...
Alabama Learning Exchange
Alex: Systems of Equations: What Method Do You Prefer?
The purpose of this instructional activity is to help students apply math concepts of solving systems of equations to real life situations. The students will use the three methods of graphing, substitution, and elimination to solve the...
Council for Economic Education
Econ Ed Link: Phillips Curve
This lesson explores the relationship of unemployment to inflation in the 1960s and after. Young scholars will discover the short-run trade-off between inflation and unemployment when unemployment is less than its natural rate. Students...
Other popular searches
- Graphing Linear Inequalities
- Graphing Inequalities
- Math Graphing Inequalities
- Graphing Compound Inequalities
- Algebra Graphing Inequalities


