Curated OER
Ziplock Chemistry
Learners investigate various chemical reactions when creating mixtures in ziplock baggies. In this chemistry lesson plan, students will recognize various chemical reactions and cite evidence. Safety and assessment strategies are included...
Curated OER
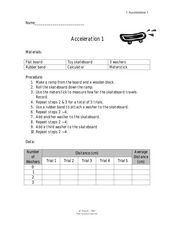
Acceleration 1
In this acceleration worksheet, young scholars use weights to increase the mass affecting the force on moving objects. Students plot a graph of their data and answer 3 questions about how the acceleration of the toy skateboard used in...
Curated OER
Force & Acceleration
Students investigate the effects of weights on the motion of a toy car. In this force and acceleration lesson plan, students use different weights, a toy car, a paper clip and string to determine how a car will move as different weights...
Curated OER
Moving Bodies
In this moving bodies worksheet, students investigate how the amount of mass of a body in motion affects its tendency to remain in motion. Students use a meter stick as a ramp, marbles, string and a wooden block to determine how far a...
Curated OER
Olympic Line Graphs
Sixth graders examine how to make line graphs. For this Olympic line graph lesson students make line graphs and search the given Internet sites to find data on their summer Olympic Game.
Curated OER
The Miracle Fish: Learning to Design an Experiment
Students develop procedures to explore the behavior of fish. In this scientific experiment lesson students from a hypothesis, write a question, identify different variables and controls in their experiment.
Curated OER
Interpreting Graphs
Students investigate graphs. In this graphing lesson plan, students create a graph regarding the population of California. Students extrapolate answers concerning the data set.
Curated OER
Data Analysis
In this data analysis worksheet, students solve and complete 4 different types of problems. First, they reduce the data provided to find the means, and graph the means in a line graph. Then, students graph the data from each mixture...
Curated OER
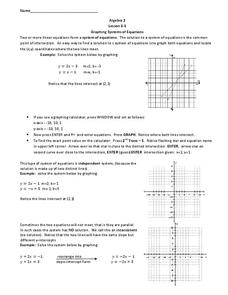
Graphing Systems of Equations
For this Algebra II worksheet, 11th graders use graphing to determine the solution to a system of linear equations. The two page worksheet contains explanation and three guided problems. Answers are not included.
Curated OER
Spaghetti Bridges
Students thread a piece of spaghetti through the holes in the cup. One person suspend the cup by placing each index finger approximately one inch in from the ends of the spaghetti.
Curated OER
Spaghetti Bridges
Eighth graders experiment with building bridges of spaghetti, pennies, and a cup to determine how varying the number of spagetti pieces affects the strength of the bridge. They graph their results and interpret the data.
Curated OER
Lab Report Template
Students write a paragraph (complete sentences) which explains what they did in the lab.
Curated OER
Choosing a Summer Job
What did you do over your summer vacation. Young wage earners must compare summer job options, and determine when each job earn the same amount and what that amount be. This be done by creating, graphing, and solving systems of...
Curated OER
Suicides And Suicide Rates
Students investigate suicide using a variety of criteria and create a bar graph before discussing the results as a class.
Curated OER
Chart the Stars
Seventh graders find constellation distances and plot the stars. In this star lesson, 7th graders plot the star points for Canis Major. Students use graphing calculators to graph the constellation. Students choose another constellation...
Curated OER
Lesson 3: Understanding Population Growth
Students explain population growth in Maryland and its relationship with age structure, household growth and consumption of land.
Curated OER
Bungee M&M's
Eighth graders experiment with M&M's and a cup attached to a spring to to simulate a bungee jump. They graph the results of the experiment and make predictions for continuing the experiment. They determine the "line of best fit."
Curated OER
Graphing the Elephant Seal Population Data
Students are able to graph data that they generated in the elephant seal exercise using proper format and labeling. They are able to interpret the graphs they created and make A) conclusions, and B) predictions based on that graph.
Curated OER
High School Mathematics Problems from Alaska: AL-CAN Highway Problem
High schoolers write and solve equations converting between metric and standard measurement as they travel southeast on the Al-Can Highway.
Curated OER
Graphs
Students graph ordered pairs to model the relationship between numbers. After observing the patterns in ordered pairs, they describe the relationship, and create graphs from a data table. Students describe intervals in the graph, and...


