EngageNY
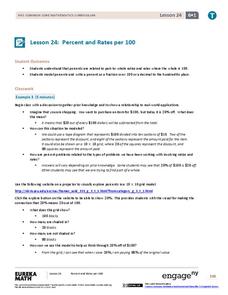
Percent and Rates per 100
What percentage of your class understands percents? Pupils learn the meaning of percents based upon rates per 100 in the 24th lesson in a series of 29. They represent percents as fractions, decimals, ratios, and models. The scholars...
EngageNY
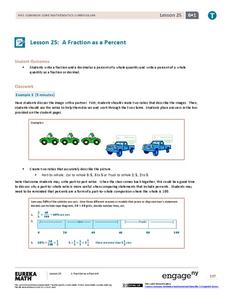
A Fraction as a Percent
It is all about being equivalent. Class members convert between fractions, decimals, and percents. By using visual models, scholars verify their conversions in the 25th portion of a 29-part series.
EngageNY
Solving Percent Problems III
What happens when combining percentage discounts? The last lesson in a series of 29 introduces the idea of combining discounts one after another. Pupils wrestle with the claim that to find the total discount, they need to only add...
Curated OER
Understanding Percent
For this understanding percent worksheet, students use a computer program to complete 8 sections, then work off the computer and answer 7 questions with fraction strips, tables and grids.
Los Angeles County Office of Education
Assessment for the California Mathematics Standards Grade 5
Test young mathematicians' knowledge with an assessment aligned to California's fifth grade state standards. The exam covers a multitude of concepts including fractions and decimals, positive and negative numbers, measurement; and...
Curated OER
Hands On: Model Percent
In this model percents practice instructional activity, students sharpen their problem solving skills as they solve 6 story problems.
Curated OER
The Meaning Of Percent
This lesson provides students with a variety of exercises which allow them to increase their ability to understand percentage.
Curated OER
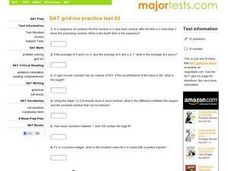
SAT Grid Ins Practice Test 3
In this SAT grid in worksheet, students solve 10 practice SAT type problems. Students determine average, volume of prisms, sum of angles, etc.
Curated OER
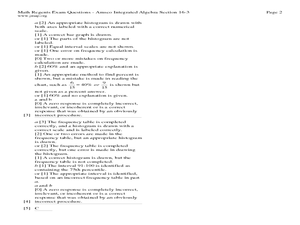
The Histogram
In this Algebra I/Algebra II instructional activity, learners construct and analyze histograms to develop a visual impression of the distributions of data. The two page instructional activity contains five problems. Answer...
Math Slice
Math Slice: Percent Grid Worksheets
This tool allows you to create worksheets where students rewrite the amounts of shaded hundred-square grids as decimals or percents.


