Curated OER
Name That Tune: Matching Musical Tones Through Waveform Analysis
Pupils detect the waveform of musical notes to determine the code for the "safe" in this forensics simulation lesson plan. They use a microphone and tuning forks along with Vernier EasyData on their graphing calculator to analyze five...
Curated OER
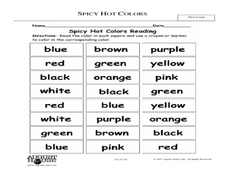
Spicy, Hot Colors
Students demonstrate an understanding of colors. In this visual arts lesson, students read the text Hot, Spicy Colors and name their favorite colors. Students complete a bar graph to show the data. Students discuss how each color can...
Curated OER
Gateway Arc Length
Learners differentiate and calculate the length of an arc. They define an arc and relate it to the area of a circle and integrate the function to solve the equations. Students use their TI calculators to graph the equation.
Curated OER
Math: How Many Red M&Ms?
Sixth graders calculate the mean, median, and mode of candy M&Ms and find the percentage of each color. Once they complete the assignment, they compare their results with those of the candy company's percentages. As an extension,...
Curated OER
Showing Favorites
In this tally chart worksheet, students use the tally chart on the page to answer 2 questions. They then solve the last 2 questions using their own tally chart.
Curated OER
A Crust Full of Rocks
In this rock worksheet, students answer seven short answer questions about the composition of the earth's crust. Questions refer to metamorphic, igneous, and sedimentary rocks.
Curated OER
Approximating Pi
Students approximate Pi using the lower and upper bound for the constant. In this algebra lesson, students work in groups of two to graph a circle and approximate Pi using the circumference. They repeat their estimation until they come...
Curated OER
Statistics Newscast in Math Class
Young scholars study sports teams, gather data about the teams, and create a newscast about their data. For this sports analysis lesson, students research two teams and define their statistical data. Young scholars compare the two teams,...
Curated OER
Saving Money Through Mathematics
Third graders discuss light sources and collect data about energy sources. They compare data and create a multiple line graph showing energy used by light sources for each student in the group. They present their graphs and write a...
Curated OER
Mr. Cobbler's Shoe Dilemma
Students employ statistics to solve real-world problems. They collect, organize and describe data. They make inferences based on data analysis. They construct, read, and interpret tables, charts and graphs.
Curated OER
Area Of Sectors
Student find the area of a sector of a circle. For this geometry lesson, high schoolers define the sector of a circle using a sketch. They find and identify examples of sector in the real world.
Curated OER
A Bar of Many Colors
Second graders use colored candies to collect data, construct double bar graphs, and find averages.
Curated OER
Grade 5 Math Test
In this grade 5 reading quiz, 5th graders complete a 26 question multiple choice quiz covering a variety of grade 5 reading concepts. Answers may be submitted on-line.
Curated OER
Pi Day (March 14)
Fourth graders determine the value of ? by measuring the circumference and diameter of circular objects such as soup cans, Oreo cookies, etc..
Curated OER
What on Earth is Greater Than?
Students compare things that are greater than, less than, or equal to, compare the Earth to other planets, and list planets from greatest size to smallest size.
Curated OER
Body Parts in Spanish
Students use Spanish to recognize and recall body parts. For this Spanish anatomy lesson, students identify and name the parts of the body in Spanish. Students describe a person physically by his hair and color of eyes. Students graph...
Curated OER
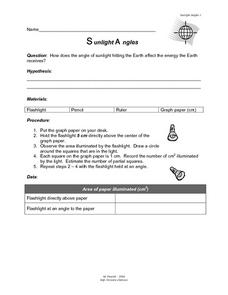
Sunlight Angles
In this sunlight learning exercise, students solve the problem of how much energy the Earth receives from the different angles of the sun. Students collect data, chart it, and come up with a conclusion.
Curated OER
Climate Comparison
Young scholars explore climate regions. In this climate lesson, students examine the climate regions of Alaska as well as the state of Hawaii. Young scholars research selected Internet sources to gather information regarding the climates...
Curated OER
The Ice Cream Shop
Second graders read books about ice cream and plan an ice cream sundae party for the class. They research ingredients and determine how much the party cost each student. They hold a mock opening for an ice cream store and have their party.
Curated OER
The Nutrients Public Transportation System
Students investigate the human circulatory system by experimenting with hoses. In this human body lesson, students create a system of hoses simulating the circulatory system which they utilize to pass objects through....
Curated OER
Constructing Parallel Lines
Students construct parallel lines using a protractor and a straightedge. In this geometry lesson, students identify the properties of parallel lines. They use Cabri to graph and observe the lines.
Curated OER
Probability With a Random Drawing
Students define probability, and predict, record, and discuss outcomes from a random drawing, then identify most likely and least likely outcomes. They conduct a random drawing, record the data on a data chart, analyze the data, and...
Curated OER
Blow and Go
Students discover how air can move things by using their breath. In this physics lesson, students hypothesize then attempt to move a pencil 1 meter using nothing but their breath. Students record data from their experiment including...
Curated OER
World Oil Packet
In this oil consumption activity, students analyze the data about oil consumption and production in 3 graphs. Students then respond to 12 questions about the data.

