Curated OER
Do Bigger Pumpkins Always Have More Seeds Than Smaller Pumpkins?
Second graders, in groups, predict the weight of a pumpkin and the number of seeds it might have. Then they find and record the actual weight and actual number of seeds. They compare and contrast the size of the pumpkin to the number of...
Curated OER
The World is a Village
Students observe Americans through the eyes of the world. In this human population lesson plan, students utilize the Internet to view the World Pop Clock and follow the world's population by the minute. Students predict what...
Curated OER
Venn Diagram and UK Basketball
Students analyze data and make inferences. In this algebra lesson plan, students collect and analyze data as they apply it to the real world.
Curated OER
Infusing Equity Gender into the Classroom
Young scholars investigate if gender makes a difference in the classroom. In this statistics lesson, students collect data on whether equity by gender in the classroom makes young scholars more successful.
Curated OER
Technobiz
Students examine candy preferences to create a plan in order to improve candy sales. In this technobiz lesson, students build spreadsheet and organizational skills by graphing and calculating data. Students are introduced to terminology...
Curated OER
Elbow Room - Exploring Population Density
In this population learning exercise, learners click on the links and research the internet about population, land, and government. Students answer 16 short answer questions including making spreadsheets.
Curated OER
Observing and Sketching the Lunar Surface
Students explore space science by conducting an illustration activity. In this lunar lesson plan, students discuss what the moon is and the role it plays for our environment on Earth. Students view images of the moon and utilize chalk to...
Curated OER
Box-and-Whisker Plots
Eighth graders measure in feet and inches and convert to explore the relationship between the converted measurements. In this measurement lesson, 8th graders use the whisker and box plot to represent the measurement of a cat. ...
Curated OER
Teaching Students About Goal Setting
Building efficacy through goal setting is a great way to give your students the tools to succeed.
Curated OER
Ladybugs in the Garden
Fifth graders estimate the size a population (ecosystems) Students make a chart from information collected then create a graph (line or bar) from this information. Students do a lesson where they observed, examine, and record data...
Curated OER
On the Road Again": Moving People, Products, and Ideas
For this lesson learners learn how to identify modes of transportation and communication for moving people, products, and ideas from place to place. Students also study the advantages and disadvantages of different modes of...
Curated OER
Active Learning
Students practice using measurements and bar graphs to solve a running problem in this active Math lesson for various age levels. The lesson meets state standards in Mathematics and requires the use of "math journals" for final...
Curated OER
Oh Deer!
Young scholars discuss the components necessary to keep animal populations alive . Then they participate in a game where they interact as deer, food, water, and shelter. The activity demonstrates that nature is not static, but changes...
Curated OER
Heat Loss
Students comprehend how heat loss is affected by exposed surface area. They decide what type of and how many data to
collect. Students decide how the results should be presented. They make a series of accurate observations
Noyce Foundation
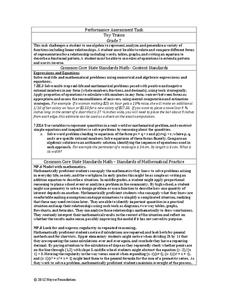
Toy Trains
Scholars identify and continue the numerical pattern for the number of wheels on a train. Using the established pattern and its inverse, they determine whether a number of wheels is possible. Pupils finish...
Curated OER
Hey, Look Me Over!
Students make observations about mealworms using hand lenses, rulers, and cotton swabs. Students complete their own mealworm observation chart, then they share their observations with the class. This is one station out of five in an...
Curated OER
Apples Galore! (Elementary, Language)
Fifth graders examine and taste 7-8 difference apples, describe the flavor/texture, then graph the results of favorites. Finally students write a paragraph describing their favorite.
Curated OER
Surfing Amusement parks
Learners must surf the Internet to find out how much it cost for his or her family to go to amusement parks in California.
Curated OER
Inclined Plane and Pulley
Students describe how inclined plane and pulleys make work easier. In this physics lesson, students calculate work done and mechanical advantage of both simple machines. They collect data from the experiment and construct graphs.
Curated OER
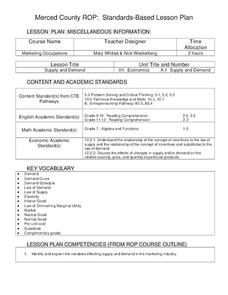
Marketing Occupations
Young scholars identify and explain the variables effecting supply and demand in the marketing industry. Then they define the terms supply and demand and graph supply and demand curves on a standard grid. Students also formulate what...
Curated OER
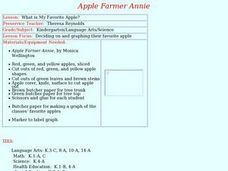
What is My Favorite Apple?
Students decide on their favorite apple and together make a graph.
Curated OER
Statistics: Misleading or Accurate?
Learners explore the concept of misleading statistics. In this misleading statistics lesson, students play a game of tag and graph the number of times each student gets tagged. Learners use the graph to determine the fastest runner in...
Curated OER
Using Non-Text Features
Second graders examine graphs and charts from their local newspaper. As a class, they discuss what the data means and how it relates to the article. In groups, they are shown two sets of graphs or charts and they practice explaining...
Curated OER
Math: How Many Red M&Ms?
Sixth graders calculate the mean, median, and mode of candy M&Ms and find the percentage of each color. Once they complete the assignment, they compare their results with those of the candy company's percentages. As an extension,...
