Curated OER
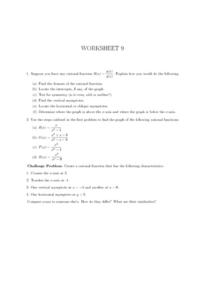
Worksheet 9, Rational Functions
In this algebra worksheet, learners tell how they would find the domain of a rational function. They find the intercepts of a rational function and graph it. Students test for symmetry, locate the asymptotes and determine where the graph...
Curated OER
Reflection
Eighth graders use a stencil to make a figure with which they discover the horizontal line of reflection, the vertical line of reflection, and the diagaonal line of reflection using coordinates.
Curated OER
Histograms: Homework
In this histograms activity, students learn how to make a histogram. Students give graphs a title, draw the axes, label the vertical axis, choose an appropriate scale, and mark equal intervals. Students label the horizontal axis with the...
Curated OER
Chapter 3 - Worksheet 3E - Functions
In this function worksheet, students observe graphs and determine if the function of the graph is odd or even. They find the inverse of a function and determine the horizontal asymptote of a function. This four-page worksheet contains...
Curated OER
Investigating Transformations
In this trigonometry worksheet, students investigate the transformations that can occur to the basic trigonometric functions. The thirteen page worksheet contains explanation, examples, and forty-seven questions. Answers are not included.
Curated OER
Track's Slippery Slope
Learners graph data of sports figure running time using x-axis y-axis to find slope of trend line, mathematically find the interpolated and extrapolated values for data points. Using the information they make predictions.
Curated OER
Read My Bar Graph!
Elementary schoolers make and use bar graphs to picture information. They learn how choosing the right scale for a bar graph can help make a persuasive argument. This is a terrific lesson on graphing which should excite your kids. There...
Curated OER
View Tubes: Student Worksheet
Here is a worksheet that is almost a lesson! In it, learners conduct an experiment in which they determine the size of objects when viewed through viewing tubes. This resource has all of the instructions and tables necessary to complete...
Curated OER
Locating IIT Using Ordered Pairs
Students investigate ordered pairs. In this math lesson, students plot and locate ordered pairs in a coordinate plane and are exposed to how to read and create a map.
Curated OER
Drug Sales Soar - Rate of Change
In this prescription drug worksheet, students answer short answer questions and create graphs on the sales of prescription drugs over a five year span. Students complete six questions.
Nature
Structural Hazards
The scientific explanation of seismic waves is detailed in the introduction. A fictional scenario is also provided for your class to discuss. Pictures and handouts that are meant to be included, however, they are not accessible....
Curated OER
Build a Bar Graph
Learners discover how to use bar graphs. They will gather and organize specific data in order to put it into a bar graph. Then they will answer several questions based on the information they have graphed.
Curated OER
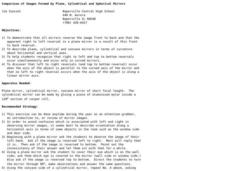
Comparison of Images Formed by Plane, Cylindrical and Spherical Mirrors
Students experiment with differently shaped mirrors. In this reflection and optics lesson, students investigate the visual effects of reflected images in mirrors. They use plane, cylindrical, and concave mirrors for the activity.
Alabama Learning Exchange
The World of Integers
Review operations related to rational numbers and integers using the include PowerPoint presentation, "Interesting Integers." Young mathematicians classify rational numbers as being natural, whole, or integers and read an article about...
Curated OER
Quad Squad
Students pretend they have visited a forest research station on an overnight field trip. They study forest fires, use compass directions, read maps, interpret imagery, and think about the impact of fire on ecosystems.
Curated OER
The Numbers Tell the Story
Students demonstrate how to gather and interpret statistical data. In this data analysis lesson plan, students search for statistics on the health effects of smoking and place the information into charts. Students create these charts...
Virginia Department of Education
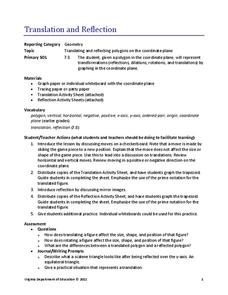
Translation and Reflection
Bring about the change you want to see in the world or at least in your lesson plans. Young mathematicians learn about translation and reflections by applying them to polygons on the coordinate plane. Results provide data to develop...
Curated OER
Graphing X, Y, Z
Seventh graders explore how proportion controls the image of a drawing. They examine a coordinate plane and discuss plotting. Student experiment drawing an object one size, and then drawing an identical object on a different scale.
Curated OER
Basic Oscilloscope Operation
In this electrical worksheet, students answer a series of 25 questions about the use and understanding of an oscilloscope used by electrical technicians. This worksheet is printable and the answers are revealed on-line.
Curated OER
Graphing It Out
Students create bar graphs. In this graphing lesson, students explore the concepts of net pay, gross pay, income and expenses. They create a bar graph to designate financial outlay during a specified period.
Curated OER
Angles in Standard Positions
Students identify positive and negative angles using the Unit Circle. In this pre-calculus instructional activity, students identify the different angles on a unit circle using the coordinate plane and the four different quadrants as a...
Curated OER
Math Lesson: What Do You Want to Know? - Country Statistics
Young scholars are able to identify the characteristics of a variety of graphs (i.e. bar graph, line graph, pie graph, scatter plot, population pyramids, etc.) They recognize how the type of data to be presented plays a role in choosing...
Curated OER
Naming Points on the Coordinate Plane
In this naming points on the coordinate plane worksheet, students name 6 coordinates off of 6 graphs. Students name the x and y-coordinates of 6 different points in all four quadrants.
Curated OER
Geometry Coordinates
In this geometry coordinates learning exercise, students plot given ordered pairs. This one-page learning exercise contains 6 problems.


