Ahisma Summer Institute
The Power of One - Math in a Different Angle
In this 2-day lesson focused on exponents, middle schoolers will cross the curriculum by engaging in science, history and language arts activities. Exponential growth will be explored using grains of rice on a chess board. Exponential...
US Department of Agriculture
Agriculture Counts
Agricultural survey and the documentation of livestock or goods was the basis for the first written language. Youngsters discuss sorting and counting, and how these skills have been used for thousands of years. They accent their class...
Curated OER
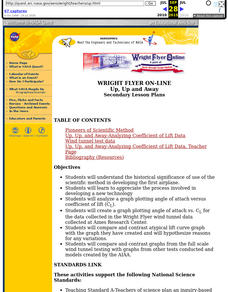
Untitled Document Aerospace Team Online:
Students explain the historical significance of use of the scientific method in developing the first airplane and appreciate the process involved in developing a new technology.
Concord Consortium
People and Places
Graph growth in the US. Given population and area data for the United States for a period of 200 years, class members create graphs to interpret the growth over time. Graphs include population, area, population density, and population...
Curated OER
Egyptian Fractions
You don't have to be an ancient Egyptian to decipher fractions in this activity that focuses on adding fractions with unlike denominators and developing fraction number sense. Egyptians represented fractions differently than we do. They...
Curated OER
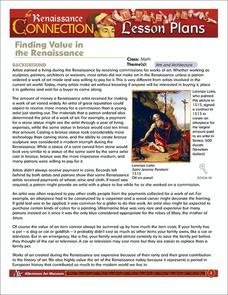
Finding Value in the Renaissance
Students explore art during the Renaissance period through the use of math. They solve word problems based upon historic documents of Renaissance Italy which contain real life situations, currencies and formulas. Students discover both...
Curated OER
Paper Plate Observation
Students analyze transits from previous scientists. They identify simple objects that could have been used for documentation in the science world. They also practice scientific inquiry using methodology.
Penn Museum
Penn Museum: China Gallery
Invite your learners to take a closer look at the art and mathematical function of dome buildings as designed by the ancient Romans. In the next segment of this attractive activity set, your young historians will then learn about ancient...
Curated OER
Local History: Mapping My Spot
Students explore maps to discover historical information about their local area. In this mapping and history lesson plan, students use panoramic maps of their own town/city to interpret historical information. Students also...
Curated OER
Measurement and Data Collecting using Image Processing
Young scholars trace the route of the historical event and measure the distance over which the people involved journeyed. A data sheet be constructed outlining the location of events, and the speed with which the journey occurred.
Annenberg Foundation
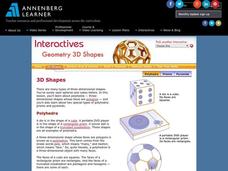
Geometry 3D Shapes: 3D Shapes
Explore vocabulary related to three-dimensional shapes. An instructional website describes the characteristics of different geometric solids. Learners can use an interactive component to view nets, faces, vertices, and edges of common...
Curated OER
"how To Think Like an Archaeologist" Suggested Pre-visit Activity for Historic Jamestowne
Young scholars study grocery receipts to simulate the archaeological activity of classifying items. They discuss the receipts as if they were find lists.
Curated OER
"Adding It Up" at James Fort
Students discuss jettons and their archaeological importance at Jamestown. They then practice using historic counting sheets and artifacts to understand the calculating methods of the early 17th Century, and identify their similarities...
Curated OER
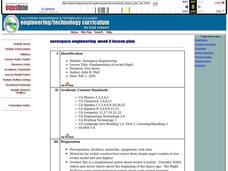
Aerospace Engineering
Twelfth graders examine the physics of rocket flight. They build and launch model rockets to measure their performances.
Curated OER
New York City Delights: The Taxi Cab
You set the rate! Step into the shoes of a taxi driver in New York City, and also pretend to be a person who uses taxis to get around town. The class will conduct collaborative research to learn about the history of taxis. Then, they...
Curated OER
Principles of Flight: Where are We?
Students explore the concept of topographical maps. In this topographical map lesson, students discuss how airplanes know where to fly. Students use topographical maps to simulate a field trip on the computer.
Curated OER
Design Explorations: Frieze Patterns
Middle schoolers will explore frieze patterns. A frieze pattern is a mathematical concept to classify designs on two-dimensional surfaces, which are repetitive in one direction, based on the symmetries in the pattern. They will explore...
Curated OER
Arkansas' Top Ten Events of the Century....Says Who? Why? Deciding What is Important in History
Middle and high schoolers work in small groups to compare four different lists published in the Arkansas Times newspaper which chose the "top ten" Arkansas news events of the 20th century. Learners look for similarities and differences...
Curated OER
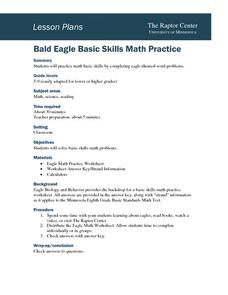
Bald Eagle Basic Skills Math Practice
Students solve basic skills math problems involving eagles. They read and discuss facts about eagles and view a video. They complete the Eagle Math worksheet and check their answers. They create additional problems and solve them.
Curated OER
High Mountain Retreat
Students explore and analyze atmospheric conditions for a high mountain retreat. They examine the relationship between altitude, atmospheric pressure, temperature and humidity at a particular location. In addition, they write reports...
Curated OER
The Demographics of Immigration: Using United States Census Data
Students work together to analyze United States Census data on immigration. They compare and contrast the data and determine how immigration numbers have changed over time. They calculate percentages and make their own conclusions...
Curated OER
Geometry of Democracy
Learners explore the architecture of New England by identifying geometric shapes. In this architectural lesson, students examine photographs of classic building architecture and use a transparency to trace geometric shapes they...
Curated OER
Our Flag Throughout History
Students work together to create a timeline of the history of the American flag. They attach pictures of presidents, flags and other illustrations. They create the timeline in red, white and blue to represent the flag itself.
Curated OER
Gathering, Recording, and Presenting Data
Sixth graders use the local newspaper to find and discuss examples of uses of statistics and the ways in which the information is presented. They create and represent their own set of data showing how students get to school each day.


