Howard Hughes Medical Institute
Spreadsheet Tutorial 5: Histogram
A professional-looking histogram is just a few clicks away. The last installment of a five-part Spreadsheet Data Analysis series focuses on histograms. Learners work through a tutorial to see how spreadsheets can help make frequency...
Curated OER
Bar and Histograms (What Would You Use: Part 1)
Students practice creating bar graphs using a given set of data. Using the same data, they create a group frequency chart and histograms. They must decide the best graph for the given set of data. They share their graphs with the...
Curated OER
Counting the Stars in Draco
In this counting stars worksheet, students construct a histogram for stars in a given star field using their apparent magnitude. Students answer 5 questions using their tabulated data and histogram to answer questions about the stars of...
Texas Instruments
Light and Day
Pupils explore the concept of collecting data as they collect data on their graphing calculator about time, temperature, and light. Learners plot the data and create histograms and box and whisker plots to analyze the data.
Beyond Benign
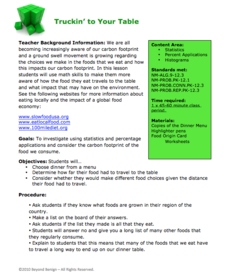
Truckin’ to Your Table
Food takes a trip to the table. Class members choose a meal from a menu and calculate the total cost of the meal including tax and tip. Using a food origin card, pupils determine how far each of the ingredients of a meal traveled to end...
Curated OER
At a Glance: Genetic Variation
Students conduct a class survey of a variety of human traits and construct histograms of the collected data. They explore how they are alike and different and play a game that introduces the concept of each individual's uniqueness.
NASA
Benford's Law
In this Benford's Law learning exercise, high schoolers read about the first digit frequency of numbers. Students solve 3 problems about sunspot numbers, solar wind magnetism and the depth of the latest earthquakes by using on line sites...
Curated OER
Mass/Weight/Data/Graphing-What Is The Mass of a Dinosaur?
Students determine the mass of various "dinosaur eggs" and graph their data. In this mass, weight, data and graphing lesson plan, students measure the mass of different weighted "dinosaur eggs". They record their data and transfer it to...
Curated OER
Getting the Lead Out
The article for this activity no longer accessible through the links in the lesson plan, but can be found in the National Center for Biotechnology Information website. After reading it, environmental science students answer questions and...
Curated OER
Sampling Snoops
Students practice formulating a hypothesis and designing an experiment to test the hypothesis. They identify several sampling techniques they can use to test their hypotheses.
Curated OER
Tree Tally
Students examine different tree species. In this tree species lesson, students visit a forest. Students participate in a game called Forest Leap Frog while at the forest.
NASA
Analyzing Tiny Samples Using a Search for the Beginning Mass Spectrometry
Teach the basics of mass spectrometry with a hands-on lesson. The fourth in a series of six lessons explores how mass spectrometry measures the ionic composition of an element. Learners then compare and contrast relative abundance and...
Illinois Valley Community College
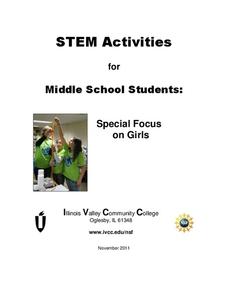
STEM Activities for Middle School Students
Use STEM activities within the class to provide connections to concepts. The resource includes activities that range from working with buoyancy to building rockets and launching them. Other activities involve the engineering design...
Beyond Benign
Water Bottle Unit
How much plastic do manufacturers use to create water bottles each year? The class explores the number of water bottles used throughout the years to determine how many consumers will use in the future. Class members compare different...
Curated OER
Using Color as Defense
Learners explore mimicry and crypsis, participate in hands-on predator-prey activity, and practice calculating averages and graph results in histogram.
Curated OER
Disease Lesson
Ninth graders examine rates, matrices, histograms, line graphs, data analysis and data presentation in order to develop an understanding of how these concepts apply to a the effects of a specific disease.
Curated OER
The Millikan L'Eggs Experiment
Students discover a pattern to mysterious eggs made by their teacher. In this mass lesson, students must uncover a secret pattern given plastic eggs and a balance. Students find the eggs have been created with a pattern and draw...
Curated OER
Alcohol Use, Abuse, and Alcoholism
Students examine influences contributing to alcohol use and abuse. They asses the genetic and environmental factors involved in alcoholism. They create a histogram for modeling alcohol use and calculate the results into percentages of...
Teach Engineering
Breathing Cells
Pairs work together to determine whether unknown solutions are either acids or bases by using a red cabbage indicator solution. After determining the general pH of the unknown solution, classmates blow into the same indicator after...
Curated OER
Suited for Space
A fantastic lesson on survival in outer space should excite your learners! Pupils explore the challenges that living, working, and surviving in space elicit. They focus on the spacesuit itself; how it protects astronauts, and enables...
Curated OER
Exploring Renewable Energy Through Graphs and Statistics
Ninth graders identify different sources of renewable and nonrenewable energy. In this math instructional activity, learners calculate their own carbon footprint based on the carbon dioxide they create daily. They use statistics to...
Virginia Department of Education
Heat and Thermal Energy Transfer
How does radiation affect our daily lives? Answer that question and others with a lesson that discusses radiation and its use in thermal energy transfer through electromagnetic waves. Pupils investigate vaporization and...
Virginia Department of Education
The Rate of Motion
How much time does it take to jump over three balloons? Pupils calculate the speed of tasks that require different motions. They determine motions for tasks such as walking, skipping, hopping, and jumping before creating a...
Other popular searches
- Bar Graphs and Histograms
- Bar Graphs Histograms
- Interpreting Histograms
- Creating Histograms
- Making Histograms
- Frequency Histograms
- Frequency and Histograms
- Math Lessons Histograms
- Histograms and Bar Charts
- Math Statistics Histograms
- Histograms Median
- Hypothesis and Histograms


