Curated OER
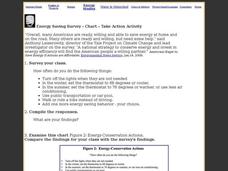
Energy Saving Survey - Chart - Take Action Activity
In this saving energy instructional activity, students survey the class about saving energy, examine an energy chart, and answer short answer questions. Students complete 4 tasks.
Pennsylvania Department of Education
Freckle Face
Students collect and record data. In this early data analysis lesson, students gather data about their partners face. As a class, the students use tally marks and pictographs to record the data and answer question about the information...
Curated OER
Scatter Graphs
In this scatter graphs worksheet, students learn a way of illustrating information about two related values. Students complete 30 questions about the graphs. Note: One of the graphs has English pounds. This is intended as an online...
Curated OER
More on Limits, Graph Sketching, and L'Hopital's Rule
In this limits worksheet, students compute the answers to thirteen limits problems. They answer one short answer question. Students follow listed steps to simplify two limits problems. Students answer three short answer questions about a...
Curated OER
An Immigration Graph
Students practice reading and understanding information in a table and converting the information to graph form. They create a graph showing the number of immigrants per country of origin between 1899 and 1924.
Curated OER
Graphing Activity
In this probability and statistics learning exercise, students work with a family member to construct graphs based on real life data. The two page learning exercise contains three questions. Answers are not included.
Curated OER
Graphing Regions: Lesson 2
Students identify and analyze geographical locations of inventors. They each identify where their inventor is from on a U.S. map, discuss geographic patterns, and create a t-chart and graph using the Graph Club 2.0 Software.
Curated OER
Weather Graph
In this graphing worksheet, 3rd graders study a line graph pertaining to weather. Students respond to 8 short answer questions using the information that is presented in the graph.
Curated OER
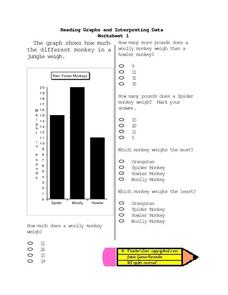
Reading Graphs and Interpreting Data
In this math worksheet, 4th graders interpret a graph and answer five questions to determine the weights of three different types of rain forest monkeys.
Curated OER
Recognizing Bias in Graphs
In this bias in graphs worksheet, students examine graphs and explain the data. They determine why the graph is or is not biased. This four-page worksheet contains approximately 6 problems. Explanations and examples are provided.
Curated OER
Jellybean Graphs
Second graders predict and graph data based on the color of jelly beans they think are in a handful. In this prediction lesson plan, 2nd graders will predict how many of each color jellybean are in a handful. Then they graph these...
Curated OER
Point Graphs
Learners experiment with point graphs. For this math lesson, students are divided into groups and perform an experiment to see how high a ball bounces, recording their results on a point graph. Learners then answer provided questions.
Curated OER
Tally Charts and Graphs
Fourth graders play the game 'Data Picking', where they collect data, place the data into a tally chart, and choose the circle graph that best represents the data. They go to the Mathfrog website and select 'Picking'. Students choose...
Curated OER
Coordinate Plane and Number Line
In this graph and number line worksheet, students answer multiple choice questions about points on a graph and points on a number line. Students answer 10 questions.
Curated OER
Unit II Worksheet 4 - Constant Velocity/Motion Maps
This is a smart approach to displacement concepts. Physics learners analyze a motion map and then draw qualitative graphs for time versus displacement and time versus velocity. Get your class thinking critically through the use of a very...
Kenan Fellows
Density
Most scholars associate density with floating, but how do scientists determine the exact density of an unknown liquid? The third lesson in a seven-part series challenges scholars to find the mass and volume of two unknown liquids. Each...
It's About Time
The Doppler Effect
In 1842, Christian Doppler proposed a theory relating the change of wavelengths based on motion. Young scholars observe the Doppler Effect on a small scale in a ball, on a larger scale from a car, and on the largest scale studying the...
Concord Consortium
Sine Solution
How many times can eager mathematicians catch the waves? Pupils find the solutions of three different trigonometric equations. They then determine the effect of the slope of a line that intersects a trigonometric function and the number...
Curated OER
Twelve Days of Christmas--Prediction, Estimation, Addition, Table and Chart
Scholars explore graphing. They will listen to and sing "The Twelve Days of Christmas" and estimate how many gifts were mentioned in the song. Then complete a data chart representing each gift given in the song. They also construct...
Curated OER
Review Set
The topics covered in these multiple choice questions are about atomic structure and bonding, state configurations, pressure and solution concentration, and energy graphs. This is a midterm review which could be used with the whole...
Mathematics Assessment Project
Middle School Mathematics Test 2
A 13-page test with two 40-minute sections covers multiple years of math content. It incorporates applied problems and mathematical analysis.
CCSS Math Activities
Smarter Balanced Sample Items: 8th Grade Math – Target D
Can learners determine solutions associated with lines? A slide presentation contains sample items for the Smarter Balanced 8th grade math Target D covering solving linear equations and systems of linear equations. Items illustrate the...
Curated OER
MAP Practice
In this geometry activity, students create circle, line and bar graphs using different comparisons of events. There are 24 questions with an answer key.
Curated OER
Linear Regression and Correlation
Learners explore scatter plots. In this linear regression lesson, groups of pupils graph scatter plots and then find the line of best fit. They identify outliers and explain the correlation. Each group summarizes and shares their...


