Willow Tree
Bar Graphs
Circles, lines, dots, boxes: graphs come in all shapes in sizes. Scholars learn how to make a bar graph using univariate data. They also analyze data using those bar graphs.
Willow Tree
Scatterplots and Stem-and-Leaf Plots
Is there a correlation between the number of cats you own and your age? Use a scatter plot to analyze these correlation questions. Learners plot data and look for positive, negative, or no correlation, then create stem-and-leaf plots to...
Willow Tree
Line Plots
You can't see patterns in a jumble of numbers ... so organize them! Learners take a set of data and use a line plot to organize the numbers. From the line plot, they find minimum, maximum, mean, and make other conclusions about the data.
Curated OER
Weather, Data, Graphs and Maps
Students collect data on the weather, graph and analyze it. In this algebra lesson, students interpret maps and are able to better plan their days based on the weather reading. They make predictions based on the type of clouds they see.
Willow Tree
Line Graphs
Some data just doesn't follow a straight path. Learners use line graphs to represent data that changes over time. They use the graphs to analyze the data and make conclusions.
Curated OER
Bungee Jump Lab
Student apply linear relationships to the real world. They use Ken and Barbie dolls and experiment to find the line of best fit. They collect data, analyze data, and make predictions from it. The students also use Microsoft Power Point...
Willow Tree
Histograms and Venn Diagrams
There are many different options for graphing data, which can be overwhelming even for experienced mathematcians. This time, the focus is on histograms and Venn diagrams that highlight the frequency of a range of data and overlap of...
Willow Tree
Box-and-Whisker Plots
Whiskers are not just for cats! Pupils create box-and-whisker plots from given data sets. They analyze the data using the graphs as their guide.
Curated OER
Logarithmic Transformations of Data
Young scholars investigate and study logarithmic equations. In this precalculus lesson plan, students analyze the data behind the function. They define each graph as positive, negative or no correlation. They find the line of best fit.
Curated OER
Graphs
Students explore graphs and define the different ways they are used to display data. In this algebra lesson, students collect data and plot their data using the correct graph. They draw conclusions from their graphs based on their data.
Curated OER
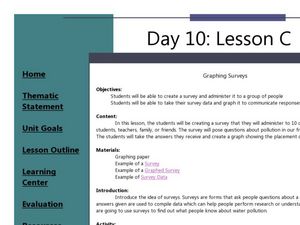
Graphing Surveys
Students collect data and graph it. In this algebra lesson, students create a survey for their classmates and teachers. They analyze the results from the survey and graph it. They draw conclusion from their data based on the graph.
Curated OER
Name That Tune: Matching Musical Tones Through Waveform Analysis
Pupils detect the waveform of musical notes to determine the code for the "safe" in this forensics simulation instructional activity. They use a microphone and tuning forks along with Vernier EasyData on their graphing calculator to...
Curated OER
Squares in the Light
Students collect and analyze data using a graph. In this algebra lesson, students explain their findings orally and with a graph. They use their knowledge to solve real life scenarios.
Curated OER
Proportionality in Tables, Graphs, and Equations
Students create different methods to analyze their data. In this algebra lesson, students differentiate between proportion and non-proportional graph. They use the TI-Navigator to create the graphs and move them around to make their...
Curated OER
Weather Watchers
Students collect and analyze data about the weather. For this algebra lesson, students organize and graph their data using graphs, line plots and stem and leaf plots. They make observation and draw conclusion using their data.
Curated OER
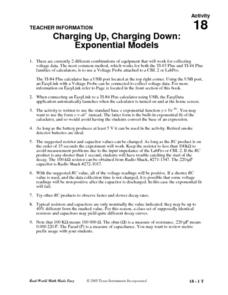
Charging Up, Charging Down
Learners collect and analyze voltage data. Then, they investigate exponential functions using the TI and a Voltage Probe and graph their data and analyze it using a table.
Curated OER
Dynagraphs
Students collect and graph their data. In this precalculus lesson, students identify the input and out of a function. They find the domain and range and the inverse of a function.
Curated OER
Geometric Sequences and Series
Learners find common ratios of geometric sequences on a spreadsheet. Using this data, they create scatter plots of the sequences to determine how each curve is related to the value of the common ratio. They will consider whether series...
Curated OER
Math TODAY - Breast Cancer Risks
Learners explore data that be modeled by a logistic function. They have the opportunity to study real-life data and create a mathematical function to model the data and make a prediction.
Curated OER
Exploring Circles
Learners explore circles using a graphing calculator. In this circles lesson, students write the equation of a circle with a given center and radius length. Learners find the most appropriate model for each combination of data they...
Curated OER
"You're Hired!'
Students investigate linear programming using the TI. In this algebra lesson, students collaborate and graph linear inequalities on a TI. They analyze their data and present it to the class.
Curated OER
Tune...Um!
Students collect real data on sound. In this algebra lesson, students use a CBL and graphing calculator to observe the graph created by sound waves. They draw conclusion about the frequency of sound from the graph.
Curated OER
Line of Best Fit
Students explore the concept of linear regression. In this linear regression lesson, students do a Barbie bungee activity where they collect linear data. Students plot their data using a scatter plot. Students determine a line of best...
Curated OER
Venn Diagram and UK Basketball
Students analyze data and make inferences. In this algebra activity, students collect and analyze data as they apply it to the real world.


