Curated OER
Does Global Warming Increase the Intensity of Atmospheric Natural Disasters?
Students study global warming by communicating the problem, process and solutions. In this global lesson plan students use graphs, research and write a critical stance on natural disasters.
Curated OER
Hypothermia: Temperature Changes Under Varying Conditions
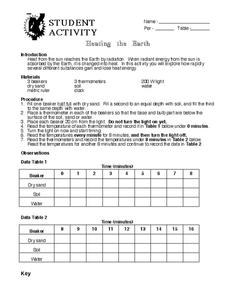
Students conduct an experiment to determine what type of clothing would be most suitable for outdoor activities. They determine the temperature changes of the skin under various wet clothing materials and graph the temperature changes. ...
Curated OER
Rain On
Fourth graders study the water cycle and clouds. In this water cycle and cloud lesson, 4th graders determine the definition of condensation and watch a demonstration in which the teacher makes a cloud in a bottle. They discuss the water...
Curated OER
Filling Up
In this filling up worksheet, students calculate the E85 per gasoline-gallon equivalent price to the E85 price per gallon to complete a chart of "alternative fuel". They use the data along with the price per gallon of gasoline to plot...
Curated OER
Guetemala's Changing Forest
Eighth graders compare their local ecological zone to the tropical rainforest. In this natural ecology lesson, 8th graders complete an activity about the differences in ecological zones. They compare their biome to the Guatemalan...
Curated OER
Full of Hot Air
Students investigate technology and its many designs to make our lives easy. In this science lesson, students build a hot air balloon and answer specific questions about weight and rides in the hot air balloon. They analyze their data...
Curated OER
Tech Algebra: A Statistics Study
Students use the internet to gather a minimum of thirty pieces of data. Students create box and whisker graphs, and stem and leaf plots from the information. They calculate mean, median, mode, and range. Students write a summary and...
NOAA
El Niño
El Nino, La Nina ... and the Santa Maria? The 11th installment of a 23-part NOAA Enrichment in Marine sciences and Oceanography (NEMO) program explains the mechanism of El Nino/Southern Oscillation. Pupils use previous data to determine...
Teach Engineering
Maximum Power Point
Investigate the maximum power output of a photovoltaic panel with a instructional activity that introduces the class to the maximum power point. Individuals learn how to determine the maximum power point of a solar panel by using Ohm's...
Science Geek
Earth's Atmosphere
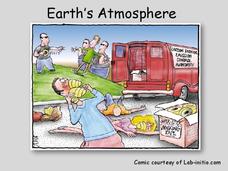
Ozone gas absorbs the harmful UV-B rays and helps protect humans. An informative presentation begins with the layers of the earth's atmosphere, the pressure and temperature in each of the layers, the ozone layer, the ozone cycle,...
Curated OER
Shinto, Japan's First Religion
Young scholars participate in centers activities that enrich understanding of Japanese culture, history, geography, art, and religion.
Curated OER
Tracking the Storm
Students discuss the different types of storms that can hit land. They locate specific coordinates on a plane grid. They discuss lonsgitude and latitude to plot the coordinates of a tropical storm. They practice finding coordinates...
Curated OER
Heating The Atmosphere
In this science worksheet, high schoolers look for the answers to finding the correct temperatures that match the location in the atmosphere.
Curated OER
Blowin' In The Wind
Students predict and hypothesize the reasons for wind movement. After viewing a video, they describe the effects of a high and low pressure system and what makes the wind blow. In groups, they construct instruments that measure air...
Curated OER
Comparing Temperature, Pressure, and Humidity
Students investigate data on temperature, pressure, and humidity by downloading information from the ARM Website. Working in groups, they discover how weather impacts life in each of the ARM sites. They record weather data in their...
Curated OER
Eyewitnesses to Change
Students explore recent changes in the Artic's climate that have been observed by Artic residents. They watch videos, take notes and create a concept map. They also look at historical weather data from a specific Artic community. The...
Curated OER
Seasons
Students explore the four seasons. Through observation activities, they explore and discuss the weather changes that occur during each season. Students create a graph of the clothing that is worn during each season.
Curated OER
Chronic Conics
Fourth graders use two activities to draw four different conic sections. One activity is of a physical nature and one is traditional paper and pencil.
Curated OER
Linking Algebra to Temperature
Young scholars convert between two units as they calculate the temperature. In this algebra instructional activity, students collect data on seasonal climate and create a graph. They make conjectures based on their data collection.
Curated OER
Troical Atlantic Aerosols
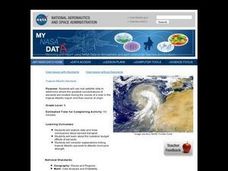
Young scholars explore the effect aerosols have upon he weather and climate. They observe NASA satellite images to explore and draw conclusions about aerosol transport. From studying the images, students track the path of aerosols. They...
Curated OER
Glossary, Index, and Table of Contents
Fourth graders use two separate sources to learn about index, glossary, and table of contents usage. In this library lesson, 4th graders use two books, Learning About Weather with Graphic Organizers, and The World Almanac for Kids, to...
Curated OER
Give Me Back My School: A Back to Basics Approach to Ecological Restoration
Ninth graders research local geography to create successful, ecological school landscaping. They determine soil type, average weather patterns and temperature graphs and use the information to select ideal plants and plant maintenance...
Curated OER
Trouble in the Troposphere
Students Use data sets from MY NASA DATA to produce graphs comparing monthly and yearly ozone averages of several U.S. cities. They analyze and evaluate the data and predict trends based on the data. In addition, they discuss and...
Curated OER
How Wet Did It Get?
Students measure the rainfall/snowfall on the playground on a rainy/snowy day with a rain/snow gauge. They draw a bar graph representing the amount of water that fell and observe a satellite image of the clouds and local weather system...


