Curated OER
Maryland’s Chesapeake Bay Landscape Long Ago and Today
Combine a fantastic review of primary source analysis with a study of Captain John Smith's influence on the Chesapeake Bay region in the seventeenth century. Your young historians will use images, a primary source excerpt, and maps...
Illustrative Mathematics
Writing Constraints
Use this resource to present your number crunchers with how to write a constraint equation and to determine viable solutions. The price of an object limits the amount that can be purchased. The speed at which you walk limits the number...
Mathematics Vision Project
Module 3: Arithmetic and Geometric Sequences
Natural human interest in patterns and algebraic study of function notation are linked in this introductory unit on the properties of sequences. Once presented with a pattern or situation, the class works through how to justify...
Mathematics Vision Project
Circles: A Geometric Perspective
Circles are the foundation of many geometric concepts and extensions - a point that is thoroughly driven home in this extensive unit. Fundamental properties of circles are investigated (including sector area, angle measure, and...
Howard Hughes Medical Institute
Gorongosa: Scientific Inquiry and Data Analysis
How does the scientific process begin? Introduce ecology scholars to scientific inquiry through an insightful, data-driven lesson. Partners examine data from an ongoing research study to determine the questions it answers. The resource...
Curated OER
A Model Solar System
If Earth is modeled by a grapefruit, what planet could be represented by a golf ball? This activity uses everyday and not-so-everyday objects to create a model of the Solar System.
PHET
Soda Bottle Magnetometer
Introduce learners to set of complete instructions that describe how to build a magnetometer that works just like the ones professional photographers use to predict auroras. The diagrams are wonderfully descriptive, and the written...
Howard Hughes Medical Institute
Lesson 8: WildCam Gorongosa Data Analysis
How do scientists analyze data to get a specific answer to a question? The final chapter in an eight-part series of activities centered around Gorongosa National Park encourages scholars to dig deeper into the scientific process. After...
Charleston School District
The Line of Best Fit
If it's warm, they will come! Learners find a line of best fit to show a relationship between temperature and beach visitors. Previous lessons in the series showed pupils how to create and find associations in scatter plots. Now,...
Statistics Education Web
Are Female Hurricanes Deadlier than Male Hurricanes?
The battle of the sexes? Scholars first examine data on hurricane-related deaths and create graphical displays. They then use the data and displays to consider whether hurricanes with female names result in more deaths than hurricanes...
101 Questions
Stopping Distances
In 2016, one in every four fatal car crashes listed speeding as a contributing factor. Pupils view videos of a car trying to come to a quick stop from four different rates of speed. They use context clues to measure and determine the...
Curated OER
Graphing in Science
Students manipulate and interpret data. They are given a dataset from a described experiment and interpret the data. A "How to Sheet for graphing" is included in lesson plan.
Curated OER
Don't Lose Your Load!
Students create graphs using collected data. In this algebra lesson, students use spreadsheet in Excel to create graphs to interpret their data and make predictions. They rewrite word problems using algebraic expressions.
Curated OER
Back-To-School Shopping
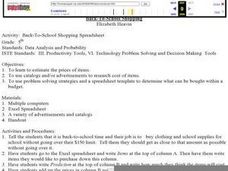
Fifth graders estimate the prices of items to be bought for back to school. They use catalogs and/or advertisements to research the cost of each of the items. They use problem solving strategies and a spreadsheet template to determine...
Curated OER
Our Favorite Season Lesson Plan
Fifth graders complete a survey about their favorite season of the year. Using Excel, they create a graph using the chart wizard and copy it into Microsoft Word. They explore the relationship between the survey and the bar graph.
Curated OER
Enhancing Writing Through Technology
Students participate in a class survey of their favorite activity to do in the snow and organize the results in a graph. They write a paragraph about the graph using language from a class-developed word web and include both an opening...
Curated OER
Virtual Field Trip
Students calculate gasoline cost per mile on a virtual field trip. They calculate the gasoline costs and travel time for each of the 2 routes, and record on a data sheet. They use Excel to create data tables for mileage, gasoline...
Curated OER
Loving Literature
First graders, after having "Are You My Mother?" by P.D. Eastman read to them, participate in group discussions or independentally work to analyze a spreadsheet to identify essential elements in the story and graph their data. In...
Curated OER
Soil Excavation
Students comprehend how percent of change and multipliers are used to determine volume for removal and replacement of soils. They calculate soil volume percent changes using data tables. They apply formulas to solve a variety of...
Curated OER
What Goes Up Must Come Down!!
Fifth graders look at actual sunrise and sunset times for their hometown to determine a pattern in the amount of daylight. They collect their data in Excel and create a chart to help them identify the pattern, then write an explanation...
Math Mammoth
Grade 1 Worktext
Use graphing, counting, and number lines to help first graders learn about addition and subtraction. An array of worksheets and activities are an excellent resource for your math lesson, whether you are focusing on counting skills...
Benjamin Franklin High School
Saxon Math: Algebra 2 (Section 4)
This fourth of twelve units in a series continues the investigation of functions through equations and inequalities. However, the modular nature of the lessons in the section make this an excellent resource for any curriculum...
Curated OER
US Historical Climate: Excel Statistical
Students import US Historical Climate Network mean temperature data into Excel from a station of their choice. They are guided through the activity on how to use Excel for statistical calculations, graphing, and linear trend estimates.
Curated OER
Rouge River Data
Young scholars participate in using Excel sofware in order to create graphs. They create the graphs using data that they gathered during the Rouge River Field Trip they attended. The produce bar graphs from the excel spreadsheets.
