Curated OER
Fishy Behavior
Here's a lab that may make you rethink that morning cup of coffee. Biology scholars test the effects of caffeine, alcohol, and nicotine on the behavior of zebrafish through an intriguing experiment. Learners observe fish...
Curated OER
World Population Activity II: Excel
Students import UNEP World population data/projections from either the World Population Prospects: The 2002 Revision Population Database - UN Population Division or a text file. They graph this data by itself, and then along with...
Curated OER
Using Fractions to Represent M&M Colors
Students investigate the concept of fraction and tangible application. In this algebra instructional activity, students use fractions to solve real life scenarios. They convert between fractions and decimals and identify the numerator...
Curated OER
Using R&R to Teach Mathematics
Second graders create a shape garden. In this polygons lesson, 2nd graders practice making shapes using a geoboard and read the book The Greedy Triangle by Marilyn Burns. Students also design a shape garden using construction...
Curated OER
The Race of Baseball All-Stars
Collect and analyze data. Pupils graph their data and model with it to solve real life problems. They use logic and deductive reasoning to draw conclusions.
Curated OER
Just Graph It!
Fourth graders evaluate various graphs for the best way to reflect statistical data. They use a spreadsheet to organize data and generate varied graphic representations. They select the graph they feel best shows their results.
Curated OER
Graphing Pockets
Second graders explore graphing. They count the number of pockets on their clothes and use Microsoft Excel to enter their data. Students create a class graph displaying their findings.
Curated OER
Creating Bar Graphs and Pie Graphs
Second graders observe a demonstration of the creation of a bar graph and a pie graph of their favorite colors. They gather information about various topics from their classmates, then organize the information, creating a bar and a pie...
Curated OER
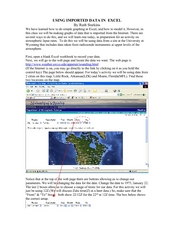
Using Imported Data in Excel
Young scholars import atmospheric data from the internet. In this earth science lesson, students graph the data they collected. They complete the worksheet after the activity.
Curated OER
Graphing Galore!
Students practice sorting and counting different objects. Using this information, they create graphs on a worksheet given to them. They describe and analyze the results and discuss them as a class to end the instructional activity. ...
Curated OER
Spreadsheet Graphs
Students create graphs using information from spreadsheets. They select a topic from the following choices: website use, digital cameras, spreadsheets, calculators or educational software. They tally the class results and create an...
Curated OER
Fast Food Survey Using Bar Graphs
Second graders conduct survey and sort data according to categories, construct bar graph with intervals of 1, and write a few sentences about their graphs.
Scholastic
Study Jams! Sound
Listen in as Mia and Sam expound on sound. It is caused by vibrations and travels in waves. It has the qualities of pitch, frequency, and volume. This hip animation displays a graph to depict the frequency and amplitude of sound waves....
Curated OER
Math Sheet #10
In this math worksheet, students examine one equation and identify the maximum and minimum value of the equation. Using Excel worksheet, students graph the equation. There is one equation with three parts on this one-page worksheet.
Curated OER
Line Graphs
Seventh graders create a line graph and identify when to use line graphs. In this line graphs instructional activity, 7th graders analyze the average temperatures of various cities. Students graph the data they collected.
Curated OER
Using My Nasa Data To Determine Volcanic Activity
Students use NASA satellite data of optical depth as a tool to determine volcanic activity on Reunion Island during 2000-2001. They access the data and utilize Excel to create a graph that has optical depth as a function of time for the...
Curated OER
Name Count and Graph
Students find the frequency of a name in selected states by using the Internet. They input data into a spread sheet. They create a graph that illustrates the gathered information.
West Contra Costa Unified School District
Correlation and Line of Best Fit
Computers are useful for more than just surfing the Internet. Pupils first investigate scatter plots and estimate correlation coefficients. Next, they use Microsoft Excel to create scatter plots and determine correlation...
Chicago Botanic Garden
GEEBITT (Global Equilibrium Energy Balance Interactive TinkerToy)
Students use the GEEBITT excel model to explore how global average temperatures are affected by changes in our atmosphere in part two of this series of seven lessons. Working in groups, they discuss, analyze graphs, and enter data to...
Polar Trec
Ozone Data Comparison over the South Pole
Did you know the hole in the ozone is seasonal and filled by January every year? The lesson uses scientific measurements of the ozone over the South Pole to understand patterns. Scholars learn that the hole grew bigger annually before...
K12 Reader
Displaying Data
It's important to learn how to display data to make the information easier for people to understand. A reading activity prompts kids to use context clues to answer five comprehension questions after reading several paragraphs about...
Polar Trec
What Can We Learn from Sediments?
Varve: a deposit of cyclical sediments that help scientists determine historical climates. Individuals analyze the topography of a region and then study varve datasets from the same area. Using this information, they determine the...
Teach Engineering
Preconditioning Balloons: Viscoelastic Biomedical Experiments
What does stretching a balloon have to do with equilibrium? Groups explore preconditioning by stretching a balloon to a point of equilibrium. They then measure the amount of force required to stretch the balloon to the same point several...
Virginia Department of Education
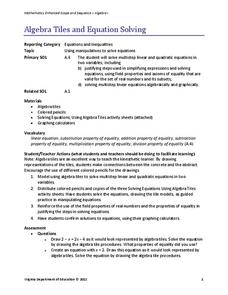
Algebra Tiles and Solving Equations
Young mathematicians solve linear equations by drawing models of algebra tiles using colored pencils. To finish, they solve the same equations algebraically and check their answers using a graphing calculator.


