Curated OER
Halloween Candy/ Sugar Content
Fourth graders examine the amount of sugar contained in Halloween candy by looking at nutritional labels from candy bars. They figure out ways to encourage people to reduce the amount of sugar they eat at this holiday. They look at the...
Curated OER
Which Objects Will Sink or Float?
First graders work in cooperative groups and utilize a variety of materials to test objects ability to sink or float. In this sink or float lesson, 1st graders discover why some object sink and others float. Students will graph results...
Curated OER
Worksheet 16 - Spring 1996
In this math worksheet, students read the instructions for setting up a computer program. Then they practice graphing the functions with the software program.
Curated OER
Don't Stress Out
Ninth graders research stress and better ways to cope with it. They create a PowerPoint presentation showing coping strategies for stress with pictures and illustrations.
Curated OER
Roman gods
Students research Roman gods. They use online resources to locate information and pictures on their assigned god and create a fact sheet using Ultimate and Creativity Center.
Curated OER
Creating The Blueprints
Students engage in a instructional activity in order to create blueprints to design an original floorplan. They use graphing paper and drawing tools to demonstrate knowledge of the instructional activity objectives. Students label and...
Curated OER
Guess What I Came From
First graders examine items made from plants. For this plant lesson, 1st graders read Plants Feed on Sunlight and view a PowerPoint presentation regarding plant growth. Students examine products that are made from plants and draw...
Starfall
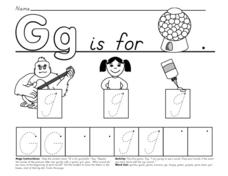
Gg is For Gumballs
Students learn to form the upper and lower case letter Gg in this printing practice instructional activity. Students trace several examples before generating examples inside boxes with starting points.
Curated OER
The Stock Market
Twelfth graders study the stock market and how to read stock market pages. They write reports about and graph the performance of various stocks. They examine economic crashes in history and write and perform a skit about the market.
Curated OER
Fraction Clue Box
Students distinguish between proper and improper fractions. They create a "Character Clue Box" that represents a fraction. Fractions are picked from a hat and then groups go outside and search for items that represent their fraction....
Curated OER
Analyzing Visual Symbols
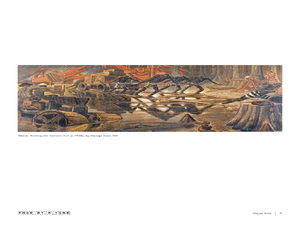
Young scholars analyze and identify visual symbols in everyday life and during a museum visit. In this visual symbol lesson plan, students study associated vocabulary such as analyze and interpret. They find and note attention getting...
Curated OER
Venn Diagram
Students classify items and numbers by using a Venn diagram. In this Venn diagram lesson plan, students use the computer to do this and classify pictures and numbers.
Curated OER
Numerical Analysis: Analyzing Root Finding Algorithms
In this root finding learning exercise, students compare graphs and shade in regions corresponding to given convergence criteria. They compute the solution of equations of one variable. This two-page learning exercise contains six...
Noyce Foundation
Snail Pace
Slow and steady wins the race? In the assessment task, scholars calculate the rates at which different snails travel in order to find the fastest snail. Hopefully, your class will move much more quickly in finishing the task!
Curated OER
Equal Parts
In this equal parts worksheet, students, working with a partner, study, formulate and calculate the answers to six word problems or drawings.
Curated OER
Worksheet 19
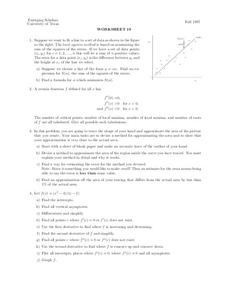
In this math worksheet, students try to fit a line to a set of data. Then they use the least squares method is based on minimizing the sum of the squares of the errors.
Curated OER
I'm Out of Here
Learners create a travel budget. In this budget activity, students research vacation destinations. Working independently, learners research destinations on the Internet and construct a budget for the vacation. Resources provided.
Curated OER
Excel Turns Data Into Information
Students use excel to analyze data. In this technology lesson plan, students enter data into the excel program to find averages and organize data.
Curated OER
Groundhog Day
Students use the SMART Board to learn about Groundhog day and create a tally chart of predictions for whether he will see his shadow or not. In this Groundhog day lesson plan, students respond to questions throughout the lesson.
Curated OER
Technology: Programming Graphics
Students use the DrScheme program to create graphics for clip art. Using graphics, they plan their designs using basic shapes, plotting its positions, and studying the relationships between points. By plotting the necessary data on...
Curated OER
Track's Slippery Slope
Young scholars graph data of sports figure running time using x-axis y-axis to find slope of trend line, mathematically find the interpolated and extrapolated values for data points. Using the information they make predictions.
Curated OER
Animals That Fly or Do Not Fly
Students create a chart and classify animals according to if they can or cannot fly. They find and cut out pictures of the animals and glue them in the correct place on the chart.
Curated OER
Tracks are for Trains
Second graders collect data on different forms of transportation and create a bar graph or pictograph with the information.
Curated OER
All of Me
Students draw pictures showing some of the different aspects of their lives, and share the pictures with classmates.
