Curated OER
Interpreting Data from Birdfeeders
What kinds of birds live in your area? Read a book about birds to your learners and explore their feeding patterns. Charts and graphs are provided in this three page packet, but consider assigning the basic questions if using with young...
Polar Trec
Global Snow Cover Changes
Snow is actually translucent, reflecting light off its surface which creates its white appearance. Pairs or individuals access the given website and answer questions about snow cover. They analyze graphs and charts, examine data, and...
Teach Engineering
Breathing Cells
Pairs work together to determine whether unknown solutions are either acids or bases by using a red cabbage indicator solution. After determining the general pH of the unknown solution, classmates blow into the same indicator after...
Nuffield Foundation
Investigating Factors Affecting the Heart Rate of Daphnia
What variables change heart rate? Young scientists observe the beating heart in Daphnia to understand these variables. They make changes in temperature, chemicals, and other factors as they graph the heart rates. Analysis questions help...
Center for Math and Science Education
Solar System Launch
Trying to understand the vastness of outer space can be quite a challenge for young scientists. Help put things in perspective with this cross-curricular activity as students work in pairs creating scaled models of the solar system,...
Curated OER
work in pairs for the activities of this lesson which include researching and identifying butterflies, writing, and a brief oral presentation.
Young scholars explore the concepts of rdioactive decay and dating. They generate a radioactive decay table, use their data to plot a decay graph, develop the concept of half-life, and then use the graph to find the age of a mummified...
Curated OER
Simultaneous Equations for Circuit Analysis
In this activity, students use Algebra to plot different solutions to equations and analyze schematics in order to answer a series of 25 open-ended questions about electrical circuits. This activity is printable and the answers are...
Curated OER
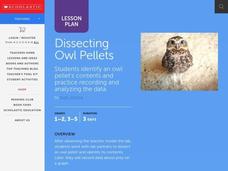
Dissecting Owl Pellets
Students watch the teacher model the dissection then in pairs, they dissect an owl pellet and identify its contents. They record the data about its prey on a graph.
Curated OER
Historical Pollution in the Hudson: Part 2
Ninth graders practice how to format and enter data into an Excel spreadsheet, make a graph, and interpret graphed data. They recognize how the pollution in the Hudson River has changed over time, and explain the consequences of these...
Curated OER
Little Auk Survival Challenge
A bird's life is one of danger and intrigue as it struggles for survival in sometimes harsh environments. To understand how difficult surviving in the wild can be, children play a simulation game where they act as little auks, birds from...
Texas State Energy Conservation Office
Investigation: Building a Parabolic-Trough Collector
Amateurs of alternative energy build a mini parabolic-trough solar energy collector and use it to heat water. Temperature is recorded over a three-minute period and the data is graphed and analyzed. Note that in order to paint aquarium...
Curated OER
Drug Sales Soar - Rate of Change
In this prescription drug worksheet, students answer short answer questions and create graphs on the sales of prescription drugs over a five year span. Students complete six questions.
Curated OER
Bugs, Bugs, Everywhere!
Students collect and compare bugs using magnifying lenses and graph data based on their comparisons. In this bugs lesson plan, students also make an aspirator by using a jar, tubing, and screen.
Curated OER
Student Worksheet
How are bubbles made? A simple experiment involving the construction of bubbles is available in this lab worksheet. A fun activity prompts pairs of learners to use dish soap in order to make bubbles. They keep track of the size of the...
Chicago Botanic Garden
Climate Change Around the World
It is unknown if cloud cover increases in response to carbon dioxide levels changing, helping climate change slow down, or if cloud cover decreases, allowing Earth to warm faster. Part four in the series of five lessons has classes...
Polar Trec
What Can We Learn from Sediments?
Varve: a deposit of cyclical sediments that help scientists determine historical climates. Individuals analyze the topography of a region and then study varve datasets from the same area. Using this information, they determine the...
Curated OER
Unit 3: Scientific Writing
Write-on! Demonstrate a writing model and support learners as they write an informational essay on a water resource issue of your (or their) choosing. The lesson plan provides a well-scaffolded summative writing experience that wraps up...
Curated OER
Chart the Stars
Seventh graders find constellation distances and plot the stars. In this star lesson, 7th graders plot the star points for Canis Major. Students use graphing calculators to graph the constellation. Students choose another constellation...
Curated OER
Ecology - Biodiversity Lab
Studnents examine the degree of biodiversity that exists in one's everyday environment, in order to develop an understanding of how scientists classify organisms and to explain why biodiversity is important for living things.
Curated OER
Disease Lesson
Ninth graders examine rates, matrices, histograms, line graphs, data analysis and data presentation in order to develop an understanding of how these concepts apply to a the effects of a specific disease.
Curated OER
Building a Scale Model
Third graders create a model of the solar system. In this solar system lesson, 3rd graders create a scale model of the solar system. Working in pairs students solve mathematical problems to correctly measure the distance each planet is...
Curated OER
The Effect of Math Anxiety on Cardiovascular Homeostasis
Students examine the effect stress due to test anxiety may have on the heart. As part of the experiment, students hypothesize, collect data, graph data, analyze data and formulate an understanding of their personal level of stress and...
Curated OER
Memory/Physiology Lab Activity
Students investigate the nervous system and how physical distractions influence mental performance. They work in pairs as a researcher and subject and memorize a series of words with no distractions. After repeating the list of words,...
Curated OER
Ignoring Friction - Not This Time!
Students discover the factors affect friction. Students, working in lab pairs, complete various experiments in order to discover what factors effect the amount of frictional force a block has as it is pulled across different surfaces.


