Curated OER
Graphing Lines That Don't "Fit"
How can you graph lines that don't seem to fit on the given graph? What makes a line straight? What does the rate of change mean when graphing a line? How do you know if a slope is positive or negative? How do you know if the graph of a...
Del Mar College
All About Lines
This resource should be called "All About Lines, and Then Some!". Packed full of all the key components of linear functions, learners review how to set up different equations, find intercepts, and graph. All the main topics are included...
EngageNY
The Graph of a Linear Equation—Horizontal and Vertical Lines
Graph linear equations in standard form with one coefficient equal to zero. The lesson plan reviews graphing lines in standard form and moves to having y-coefficient zero. Pupils determine the orientation of the line and, through a...
EngageNY
The Slope of a Non-Vertical Line
This lesson introduces the idea of slope and defines it as a numerical measurement of the steepness of a line. Pupils then use the definition to compare lines, find positive and negative slopes, and notice their definition holds for...
K-5 Math Teaching Resources
Blank Bar Graph Template
This template is just begging for your young mathematicians to fill it in with colorful bar graphs! With horizontal and vertical axes in place and grid lines for added support, this is a great resource for teaching children how to...
Curated OER
Read My Bar Graph!
Elementary schoolers make and use bar graphs to picture information. They learn how choosing the right scale for a bar graph can help make a persuasive argument. This is a terrific lesson on graphing which should excite your kids. There...
Curated OER
Graph Paper Patterns
Young artists divide a piece of graph paper into sections using rectangles, squares, and triangles. They then fill each section with patterns of shape and color. Elementary graders describe how their patterns are organized. Secondary...
Curated OER
Usage and Interpretation of Graphs
Students explore graphing. In this graphing lesson, students predict how many shoe eyelets are present in the classroom. Students count eyelets and work in groups to organize and chart the data collected. Students put all the data...
Curated OER
Usage and Interpretation of Graphs
Cooperative groups are formed for this graphing activity. Each group must construct a graph that represents how many eyelets (the holes for laces in shoes), are present in their group. A whole-class bar graph is eventually constructed...
Flipped Math
Reflections
Take some time to reflect on graphing. Learners count a point's distance from the line of reflection to create reflections of geometric figures. Given the rules for four basic lines of reflections, pupils determine the points to create...
Curated OER
Reading Line Graphs
In this line graphs worksheet, 4th graders, after studying a line graph illustrating Emily's hiking record, answer 4 short answer questions relating to the line graph.
Curated OER
Parallel and Perpendicular Lines
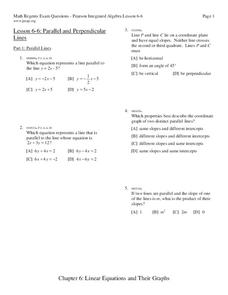
Young geometers get some solid skills practice in evaluating slopes. Beginning with the basics of slope through two points and progressing through properties of parallel and perpendicular lines, the building of skills is gradual and...
Education Development Center
Points, Slopes, and Lines
Before graphing and finding distances, learners investigate the coordinate plane and look at patterns related to plotted points. Points are plotted and the goal is to look at the horizontal and vertical distances between coordinates and...
Curated OER
Walking the Plank
This is a cool math activity. Kids collect and interpret data based on a physical act. A board is balanced between a scale and a step, learners record a peer's weight as it decreases while s/he walks further away from the scale. They...
Curated OER
Interpreting Line Graphs
Fifth graders interpret line graphs. In this graphing activity, 5th graders first begin by reviewing the difference in bar and line graphs and what they are used for. Students practice interpreting the data on various line graphs and...
Curated OER
Comparing Data on Graph A and Graph B
Second graders gather and graph data. In this graphing lesson, 2nd graders collect data and graph this information using tally charts, bar graphs, pictographs, or tables. They make predictions about the outcomes.
Curated OER
Practice Graphing y = mx + b
Ninth graders graph linear equations of the form y= mx + b. In this algebra lesson, 9th graders are able to graph a line given the slope and y-intercept. They can write the equations of a line given the graph of a line and can...
Curated OER
Identifying Horizontal, Vertical and Oblique Lines
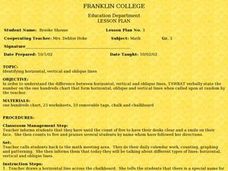
Third graders watch the teacher draw a horizontal line across the board. They listen to the definition of horizontal and has a student demonstrate putting their body in a horizontal position. This is repeated with a vertical line. The...
Curated OER
Data Analysis, Probability, and Discrete Math: Line Graphs
Eighth graders analyze data from line graphs. They discuss the purpose of line graphs, identify the parts of a line graph, answer questions about various graphs, and complete a worksheet. This lesson includes a script to teach along with.
Curated OER
The Human Graph
Students produce a graph of favorite colors. For this graphing lesson, students create a human graph based on their favorite color then the teacher transfers the data to a bar graph. Students compare the lines on the graph before...
Curated OER
The Order of Things on a Coordinate Grid
Learners are able to identify ordered pairs on coordinate plane, and graph points on a coordinate plane. They are able to write an ordered pair for each of the points on a graph, and create a design or picture using ordered pairs.
Curated OER
Parallel and Perpendicular Lines
In this algebra/geometry activity, students investigate the slopes and equations of parallel and perpendicular lines. The two page activity contains a combination of eleven multiple choice and free response questions. Solutions are...
Curated OER
Writing and Graphing Linear Equations on a Flat Surface
In this linear equations worksheet, students write the equation of a line with given characteristics. They identify the slope of a line and the y-intercept. Explanations and examples are provided at the beginning of the worksheet. This...
Utah Education Network (UEN)
Finding Slope of a Line from Graphs, Tables, and Ordered Pairs
Middle schoolers explore the concept of slope in numerous ways and start to look at simple linear equations. They describe the slope in a variety of ways such as the steepness of a line, developing a ratio, using graphs, using similar...


