Curated OER
Hybrid Vehicles: Cut Pollution and Save Money
Math and science meet in this lesson on hybrid electric automobiles. This 24-page resource provides everything you need for teaching a lesson that compares the use of internal combustion engines to hybrid electric engines. Participants...
Curated OER
F(x)g(x): A Tale of Two Functions
In this graphing functions worksheet, learners solve four problems where they graph given functions, find the sum related to the area under the curve and determine an integral.
Physics Classroom
Position-Time Graphs - Conceptual Analysis
Increasingly, colleges and employers want applicants with strong conceptual analysis skills, so give them some practice! Applying these skills to position-time graphs encourages synthesis of knowledge. To complete an installment of a...
Kenan Fellows
Reading Airline Maintenance Graphs
Airline mechanics must be precise, or the consequences could be deadly. Their target ranges alter with changes in temperature and pressure. When preparing an airplane for flight, you must read a maintenance graph. The second lesson of...
Curated OER
Mystery Liquids: Linear Function
High schoolers determine the linear equations of the density of water and oil by collecting data on the mass of various volumes of each liquid. They construct scatter plots from the data and use these to write the linear equations for...
Teach Engineering
Complex Networks and Graphs
Show your class how engineers use graphs to understand large and complex systems. The resource provides the beginnings of graph theory by introducing the class to set theory, graphs, and degree distributions of a graph.
Curated OER
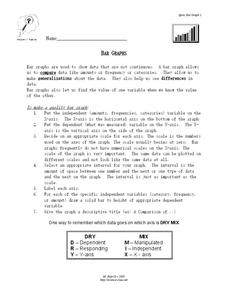
Bar Graphs
In this bar graph worksheet, students read about making quality bar graphs and they make a bar graph using given data. They answer 5 questions about their graph.
Curated OER
Murder in the First Degree - The Death of Mr. Spud
Secondary learners investigate exponential functions in a real-world scenario. They collect data on the temperature of a cooling baked potato, enter the data into lists, and graph the data using a scatter plot before finding an...
Curated OER
Regents High School Examination: Living Environment 2005
The 2005 version of the Regents High School Examination in the area of ecology is as comprehensive as previous years' exams. It consists of 40 multiple choice questions on everything from the structure of DNA to the interactions within...
Curated OER
Regents High School Examination: Living Environment 2003
The living environment, from the interior of a cell to the complex relationships among populations, are queried in this final examination. Learners look at air pollution maps, diagrams of cells, population graphs, and drawing of cells....
Curated OER
Regents High School Exam: Living Environment 2008
Tne New York Regents High School Examinations are comprehensive and include various styles of questions, includingmultiple choice and the analysis of graphs. This particular version, the 2008 Living Environment exam surveys a variety of...
Curated OER
Regents High School Examination: Living Environment 2007
Environmental science enthusiasts show what they know at the end of the year by taking this full-fledged final exam. They answer multiple choice, graph interpretation, and essay analysys questions, 73 of them in all. Topics range from...
Curated OER
Regents High School Examination PHYSICAL SETTING CHEMISTRY 2007
The University of the State of New York has designed a series of exams to be given to high schoolers. This chemistry exam is one of the most comprehensive and well-written that you will ever find. It consists of 84 questions in a variety...
Curated OER
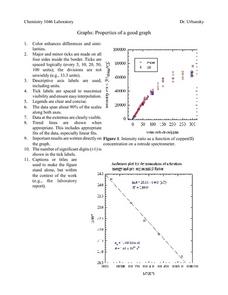
Properties of a Good Graph
In this chemistry worksheet, students examine the common characteristics of an acceptable graph that is meant to be used to display data.
Texas Instruments
TI-Nspire™ CAS
When it comes to rating educational calculators, this calculator is always near the top of this list. Now it's available as an app. There is a lot of calculator power wrapped up in this app. Not only is this a fully functioning...
Texas Instruments
TI-Nspire™
We landed on the moon with less computing capabilities than you can find in this app! Here is a multiple function calculator that takes all the power you get from a handheld and adds the wonderful large screen that only a tablet can...
Curated OER
Slope, Vectors, and Wind Pressure
A hands-on lesson using the TI-CBR Motion Detector to provide information to graph and analyze. The class uses this information to calculate the slope of motion graphs and differentiate scalar and vector quantities. There is a real-world...
Curated OER
Bouncing Ball
High schoolers collect height versus time data of a bouncing ball using the CBR 2™ data collection device. Using a quadratic equation they graph scatter plots, graph and interpret a quadratic function, apply the vertex form of a...
Curated OER
When Ants Fly
Here is a great instructional activity on constructing line graphs. Learners identify common characteristics of birds, ants common needs of all living things. They also write a story from the perspective of an ant or a bird that has lost...
Intel
What Does This Graph Tell You?
Students choose natural phenomena to research. They design and conduct experiments or simulations. Students predict, gather, and analyze data. They graph the results using a spreadsheet software.
Curated OER
Curve Ball
Create a Height-Time plot of a bouncing ball using a graphing calculator. Graph height as a function of time and identify the vertex form of a quadratic equation that is generated to describe the ball's motion. Finally, answer questions...
Curated OER
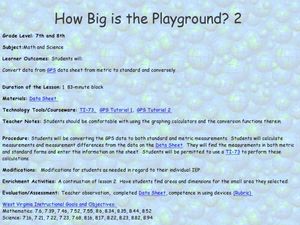
How Big Is The Playground?
Students calculate the standard and metric measurements of a playground. In this measurement instructional activity, students use GPS coordinates and graphing calculators to determine the dimensions of an area outside of the school in...
Institute of Electrical and Electronics Engineers
Get Connected with Ohm's Law
Ideal for your electricity unit, especially with middle schoolers, this lesson plan gets engineers using multimeters in electrical circuits to explore the relationships among voltage, current, and resistance. Older learners may even plot...
Curated OER
Regents High School Examination: Living Environment 2009
Emerging ecologists need a full understanding of life, from the inner workings of a cell to the complex relationships among organisms. This examination is meant to assess high schoolers after an entire year course on the living...
Other popular searches
- Algebra Graphing Functions
- Exploring Graphing Functions
- Graphing Nonlinear Equations
- Functions and Graphing


