Curated OER
Local Traffic Survey
Students conduct a traffic survey and interpret their data and use graphs and charts to display their results.
Curated OER
Pecan Power
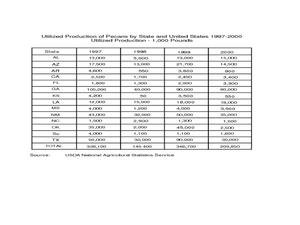
Students study the origins of pecans and complete a bar graph from the data they have discovered. In this pecan lesson plan, students draw pecans, discuss a pecan time line, and draw a bar graph comparing Arizona pecans to other...
Curated OER
The Blizzard of 1993
Students read and interpret the information from a barograph from a major winter storm. This task assesses students' abilities to interpret and analyze graphs, construct data tables and graphs, generalize, infer, apply knowledge of...
Curated OER
Songs from the Past
Young scholars research songs from the past to learn about historical events. In this music history lesson, students conduct a survey on the Star-Spangled Banner, research the song and history on various websites, and research songs in...
Curated OER
Day Four: Surveys and results
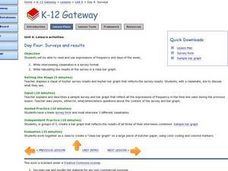
Students use expressions of frequency in the English language. In this ELL lesson, student survey their classmates and turn the information into a class bar graph.
Curated OER
Acid-Base Titration
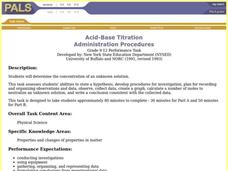
Students determine the concentration of an unknown solution. This task assesses students' abilities to state hypothesis, develop procedures for investigation, plan for recording and organizing observations and data, collect data, create...
Curated OER
Bluebird Eggs in Nestbox chart
In this bluebird eggs worksheet, students fill out the chart which resembles a bar graph on how many eggs each bluebird has and answer short answer questions. Students answer 5 questions.
Curated OER
Beatrix Potter Book Survey
In this survey activity, students ask classmates which Beatrix Potter books they have read and record their responses. Book titles are listed in the first column and tally marks are written in the second column. Students then graph the...
Curated OER
New York State Math Test Grade 4
In this New York state math test worksheet, 4th graders complete multiple choice questions on money, multiplication, graphs, and more. Students complete 39 questions.
Del Mar College
Finding the Domain
Domain to a math teacher makes perfect sense, but it can seem like gibberish to high schoolers. As it is laid out in clear terms, domain is introduced and explained among all types of functions throughout the handout. The first three...
Radford University
Projectile Motion and Quadratic Functions
Model the flight of a ball. Small groups collect time data for how long it takes to toss a ball between two people. The teacher leads a discussion about projectile motion to get the class thinking about how to calculate the equation of...
PBS
The Yo-Yo Problem
What do yo-yos and pennies have to do with linear equations? Learn about writing and solving linear equations while considering the Yo-Yo Problem and Penny Pattern Exploration from the High School Math Project. Learners utilize algebra...
Curated OER
Linear Modelling of the Life Expectancy of Canadians
Middle and high schoolers explore the concept of linear modelling. In this linear modelling lesson, pupils find the line of best fit for life expectancy data of Canadians. They compare life expectancies of men and women, and find...
Virginia Department of Education
Factoring for Zeros
Relate factors to zeros and x-intercepts. Scholars first graph quadratics in both standard and factored forms to see that they are the same. They go on to use the graphs to see the relationship between factors and x-intercepts.
Curated OER
Apple Adjectives
Study different apple varieties and use appropriate adjectives to describe them. Learners alphabetize both the apple names and the adjectives before creating spreadsheet, bar, and pie graphs. A mix of language arts, technology, and...
Curated OER
Organizing Data
In this data worksheet, students convert measurements to significant notation and determine the number of significant digits. This worksheet has 4 fill in the blank and 2 short answer questions.
Curated OER
Student Costs Data Table
Learners compare and contrast two routes selected for a virtual field trip. They create a data table of educational activities, lodging, and meal costs using Microsoft Excel software.
Curated OER
Other Equations of Lines
In this algebra worksheet, students find equations for 4 lines when given their slope and one point on the line. They write two linear equations when given two points on a line. Students analyze the equations of 3 sets of linear...
Curated OER
Point-Slope Form
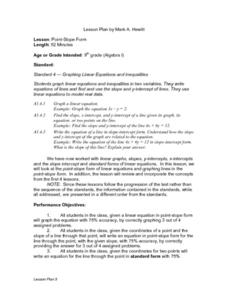
Ninth graders explore the point-slope form of linear equations and graph lines in the point-slope form. After completing the point-slope equation, they identify the slope of a line through a particular point. Students explain the...
Curated OER
Quadratics: Polynomial Form
Students determine how to use the polynomial form of a quadratic equation to find the location of the vertex on a graph. They determine how changes in the coefficients in a quadratic function affect its vertex on a graph. Students find...
Alabama Learning Exchange
Graphing Stations
Students explore the concept of graphing stations. In this graphing stations lesson, students head to various teacher set-up stations involving slope, point-slope, standard form, parallel lines, etc. Students work problems at...
Curated OER
Quadratics: Polynomial Form
Learners determine how changes in the coefficients in a quadratic function affect its graph. They determine how to use the equation to determine the intercepts of a quadratic function. Students identify the location of the intercepts...
Curated OER
Growing and Graphing
Students visit a 2nd and a 4th grade class to measure the heights of older students using large building blocks as a non-standard unit of measure. They can also measure adults in the school community. Results are displayed in...
Curated OER
Graphing and the Coordinate Plane
Students learn about the Cartesian coordinate plane, understand the four quadrants of the Cartesian coordinate plane, and plot points on the plane. Students read coordinates for a point from a graph and give the ratio of rise over run...

