Hi, what do you want to do?
National Council of Teachers of Mathematics
The Math Forum: Seventh Grade Mathematics: Data Sense
This site has some interesting ways to collect and evaluate data. There are some activities about note taking, spreadsheets, surveys, and a cool bridge construction project. Teachers may want to use this site as a resource for some...
National Center for Ecological Analysis and Synthesis, University of California Santa Barbara
Kids Do Ecology: Data and Science
Learn about conducting your own investigation with these tips on following the scientific method. Find out how to state hypothesis, make observations, collect and analyze data, and display data to share results and conclusions of your...
Alabama Learning Exchange
Alex: Great Golly Graphs
This lesson plan asks middle schoolers to create a survey project including graphs, questions, tables, and data analysis. It gives an assessment and ideas for remediation and extension as well as ways to manage behavior problems and...
Center for Innovation in Engineering and Science Education, Stevens Institute of Technology
Ciese Collaborative Projects: Down the Drain: How Much Water Do You Use?
How much water do you use everyday? Find out in this engaging investigation, where you compare your water usage with your classmates and other people around the world. An exploration filled with lots of math and science that students are...
Science Buddies
Science Buddies: Data Analysis for Advanced Science Projects
The importance of data analysis in science projects is explained. Describes common mistakes young scientists make. The article then discusses how to find out what the standard methods of data analysis are for the type of research you...
Science Buddies
Science Buddies: An Experiment in Visual Perception
Graphical methods of data presentation are a key feature of scientific communication. This project will get you thinking about how to find the best way to communicate scientific information.
TeachEngineering
Teach Engineering: Environment
Through 10 lessons and more than 20 hands-on activities, students are introduced to the concept of an environment and the many interactions within it. As they learn about natural and human-made environments, as well as renewable and...
Alabama Learning Exchange
Alex: "Ridin' Along in My Automobile"
Students will research prices of used cars to discover how automobiles lose their value over time. Students will create a chart to record their information, use their chart to graph their data, and find measures of central tendency of...
Alabama Learning Exchange
Alex: Incline Plane and the Crashing Marble
Students will measure the effects of the height of an inclined plane on the force a marble produces to move a plastic, foam, or paper cup across a table. Students will discover that the higher the incline plane, the more force produced...
Texas Instruments
Texas Instruments: The Stock Market Project
Students pick a stock that they would like to follow for a period of 2 weeks. Each day they look up the stock and chart its price. At the end of the two week period they graph their data using the graphing calculator. They compare their...
Alabama Learning Exchange
Alex: Misleading Graphs Are Da'pits!
In this interactive lesson, middle schoolers will discover how creating an incorrect graph will display misleading information. Through viewing and discussing a variety of graphs, the students will identify 5 components that graphs must...
Science Education Resource Center at Carleton College
Serc: Analyzing Greenhouse Gases and Global Temperature Data Over Time
In this activity, young scholars plot data on the concentrations of various greenhouse gases in Earth's atmosphere and look for trends. They will learn that greenhouse gases allow the Sun's light to pass through them to the surface of...
US Department of Energy
United States Department of Energy: Power Metering Project
Two part lesson focuses on applying analytic tools such as pie charts and bar graphs to gain a better understanding of practical energy use issues. Students will learn how different types of data collected affect the outcome of...
TeachEngineering
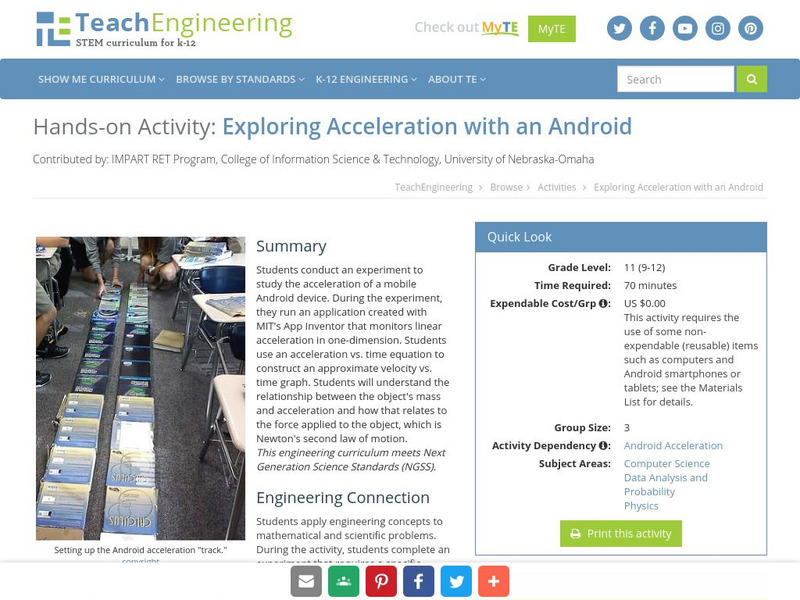
Teach Engineering: Exploring Acceleration With an Android
Students conduct an experiment to study the acceleration of a mobile Android device. During the experiment, they run an application created with MIT's App Inventor that monitors linear acceleration in one-dimension. Students use an...
Center for Innovation in Engineering and Science Education, Stevens Institute of Technology
Ciese Real Time Data Projects: Air Pollution: Sources of Particulate Matter
Find out what sources are contributing to the particulate pollution in your state. An interactive bar graph shows the major types of air pollution and their sources. This particular activity focuses on two types of particulates.
Alabama Learning Exchange
Alex: Bloodstain Pattern Doesn't Lie
Students will formulate a hypothesis about the relationship (linear, direct, indirect, etc.) between the distance a drop of blood falls and the diameter of the splatter it makes. To test their hypothesis, the students will work...
Alabama Learning Exchange
Alex: Ice Cream Sundae Survey
Students quickly realize the importance of learning how to read and find information in charts, graphs, and tables compared to finding the same information written in a paragraph. This is a fun, high energy lesson!This lesson plan was...
University of Cambridge
University of Cambridge: Maths and Sports: Olympic Records
Can you work out which Olympics athletics event each anonymised graph of Olympic records data represents? This activity, aimed at Key Stage 3 (age 11-14), gives students the opportunity to make sense of graphical data and challenges them...
University of Cambridge
University of Cambridge: Maths and Sports: Charting Success
Sports statisticians, trainers and competitors create graphs, charts and diagrams to help them to analyse performance, inform training programmes or improve motivation. This activity encourages students to consider and analyse...
University of Cambridge
University of Cambridge: Maths and Sports: Match the Matches
Decide which charts and graphs represent the number of goals two football teams scored in fifteen matches. This data handling activity is designed to get children talking meaningfully about mathematics, presenting and justifying...
Alabama Learning Exchange
Alex: Wheels All Around
Students will use skip counting to see how many wheels visit the school during specified times in one day. This lesson plan was created as a result of the Girls Engaged in Math and Science University, GEMS-U Project.
TeachEngineering
Teach Engineering: Android Acceleration Application
This unit includes two sequential lessons. In the first, students create mobile apps that collect data from an Android device's accelerometer and then store that data to a database. This lesson provides practice with MIT's App Inventor...
TeachEngineering
Teach Engineering: Energy Perspectives
Students utilize data tables culled from the US DOE Energy Information Agency to create graphs that illustrate what types of energy we use and how we use it. An MS Excel workbook with several spreadsheets of data is provided. Students...
TeachEngineering
Teach Engineering: Mouse Trap Racing in the Computer Age!
Students design, build and evaluate a spring-powered mouse trap racer. For evaluation, teams equip their racers with an intelligent brick from a LEGO MINDSTORMS NXT Education Base Set and a HiTechnic acceleration sensor. They use...


