Illustrative Mathematics
Weather Graph Data
Teaching young mathematicians about collecting and analyzing data allows for a variety of fun and engaging activities. Here, children observe the weather every day for a month, recording their observations in the form of a bar graph....
Polar Trec
How Much Data is Enough?
The next time you read a magazine or watch the news, make note of how many graphs you see because they are everywhere! Here, scholars collect, enter, and graph data using computers. The graphs are then analyzed to aid in discussion of...
Berkshire Museum
Camouflage!: Collecting Data and Concealing Color
Help young scholars see the important role camouflage plays in the survival of animals with a fun science lesson. Starting with an outdoor activity, children take on the role of hungry birds as they search for worms represented by...
Curated OER
What's in a Graph?
How many yellow Skittles® come in a fun-size package? Use candy color data to construct a bar graph and a pie chart. Pupils analyze bar graphs of real-life data on the Texas and Massachusetts populations. As an assessment at the end of...
Curated OER
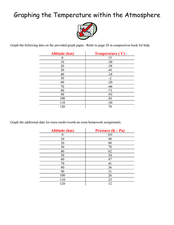
Graphing the Temperature within the Atmosphere
Musing meteorologists design graphs of the temperature and pressure changes for altitude increase in our atmosphere. The activity is pertinent to middle school earth science curriculum. Vary the type of homework you assign when teaching...
Curated OER
Data Collection
Students write a journal exercise that relates to pets. They collect information from each other in order to practice making and interpreting bar graphs. They Continue building different kinds of graphs with the group.
NASA
Exploring Data
Bring the sun to your class! Young scholars analyze actual solar wind data in the second lesson of a five-part series. Their analysis includes speed, temperature, and density data.
Chicago Botanic Garden
Plant Phenology Data Analysis
Beginning in 1851, Thoreau recorded the dates of the first spring blooms in Concord, and this data is helping scientists analyze climate change! The culminating instructional activity in the series of four has pupils graph and analyze...
NOAA
Graphing Temperatures
Battle of the hemispheres? In the fourth installment of a five-part series, young oceanographers use the NOAA website to collect temperature data from drifters (buoys), one in the Northern Hemisphere and one in the Southern Hemisphere....
Curated OER
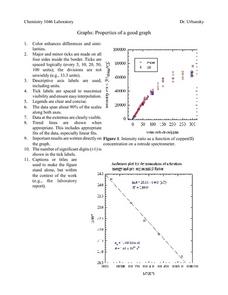
Properties of a Good Graph
In this chemistry worksheet, students examine the common characteristics of an acceptable graph that is meant to be used to display data.
Curated OER
Five Colors Bar Graph-Make a Bar Graph
Two worksheets are provided here that contain the same information but ask different questions. The first worksheet has the learner draw the graph themselves before answering the questions that follow, and the second worksheet has the...
Urbana School District
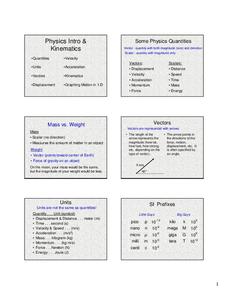
Physics Intro, Kinematics, Graphing
Some consider physics the branch of science concerned with using long and complicated formulas to describe how a ball rolls. This presentation, while long, is not complicated, yet it covers rolling, falling, and more. It compares vectors...
Curated OER
Survey of Height
In this data collection instructional activity, students survey the heights of their fellow classmates, organize their data in a data table, and create a bar graph from their data. Once bar graph is completed, students complete 2 short...
Curated OER
Red Worms Rock!
Second graders measure red worms. In this lesson, 2nd graders observe and collect data on red worms. Students measure the red worms and create a graph with the data they collect.
Curated OER
How Does Water Cool?
How fast does water cool? First fifth graders will draw a line on a graph that predicts how fast they think water can cool from boiling. Then they plot the actual data on the same graph to see if their estimate was correct.
Curated OER
Slope, Vectors, and Wind Pressure
A hands-on lesson using the TI-CBR Motion Detector to provide information to graph and analyze. The class uses this information to calculate the slope of motion graphs and differentiate scalar and vector quantities. There is a real-world...
National Wildlife Federation
The Tide is High, but I’m Holding On… Using ICESat Data to Investigate Sea Level Rise
Based on the rate of melting observed from 2003-2007 in Greenland, it would take less than 10 minutes to fill the Dallas Cowboys' Stadium. The 17th lesson in a series of 21 has scholars use the ICESat data to understand the ice mass...
NASA
Discovering the Milky Way
What do you call a tiny collection of galaxies? A puny-verse! Young scholars graph data gathered by scientists studying Cepheids. They attempt to identify a relationship between the variables through standard and logarithmical graphing....
Howard Hughes Medical Institute
Spreadsheet Tutorial 3: Column Graphs, Error Bars, and Standard Error of the Mean
There's absolutely no error in using the tutorial! Learners use spreadsheets to create column or bar graphs with error bars. They also learn how to calculate the standard error of the mean in the tutorial. This is the third installment...
Curated OER
Unit II: Worksheet 2 - Velocity vs. Time Graphs
On the first of two pages, physics aces graph velocity versus time on sets of axes. On the second page, they look at graphs of position versus time and then draw velocity versus time on graphs right next to them. This is good practice in...
Kenan Fellows
Reading Airline Maintenance Graphs
Airline mechanics must be precise, or the consequences could be deadly. Their target ranges alter with changes in temperature and pressure. When preparing an airplane for flight, you must read a maintenance graph. The second lesson of...
Howard Hughes Medical Institute
Gorongosa: Scientific Inquiry and Data Analysis
How does the scientific process begin? Introduce ecology scholars to scientific inquiry through an insightful, data-driven lesson. Partners examine data from an ongoing research study to determine the questions it answers. The resource...
Earth Watch Institute
Entering Local Groundhog Data in an Excel Spreadsheet
Here is a cross-curricular ecology and technology lesson; your learners create spreadsheets depicting the location and number of groundhog dens in a local park. They research groundhogs and analyze data about where the groundhog...
Chicago Botanic Garden
Historical Climate Cycles
What better way to make predictions about future weather and climate patterns than with actual climate data from the past? Young climatologists analyze data from 400,000 to 10,000 years ago to determine if climate has changed over time....
Other popular searches
- Data Analysis Graphing
- Graphing and Analyzing Data
- Data and Graphing
- Graphing Data Project
- Collecting and Graphing Data
- Graphing Data in Science
- Collecting Data Graphing
- Organizing and Graphing Data
- Mathematics Graphing Data
- Data Tables and Graphing
- Line Graphing Data
- Graphing Data in Astronomy


