Scholastic
Study Jams! Histograms
With so many ways to organize data, a histogram is useful when we need to graph a variety of ranges. The interactive lesson plan organizes heights into different categories, not too big and not too small, to display on a histogram. The...
Curated OER
Pictures of Data: Post Test
In this data learning exercise, students answer multiple choice questions about charts and graphs. Students answer 10 questions total.
Scholastic
Study Jams! Line Plots
Data analysts are guided through the arrangement of whole-number data onto a line plot by listening and viewing a high-quality, animated, and narrated set of slides.
CK-12 Foundation
Frequency Tables to Organize and Display Data: Favorite Films
What information can your class determine if they know the number of people attending movie showings? Using the information about the number of people at each screening, learners develop a frequency table. The pupils analyze the type of...
Curated OER
My Test Book: Reading Graphs
In this online interactive math skills worksheet, students solve 10 multiple choice math problems that require them to read and interpret graphs. Students may view the correct answers.
Curated OER
My Test Book: Reading Graphs
In this online interactive math skills worksheet, students solve 10 multiple choice math problems that require them to read and interpret graphs. Students may view the correct answers.
Shodor Education Foundation
Linear Inequalities
An interactive lesson helps individuals learn to graph inequalities in two variables. Scholars can adjust the interactive to present the inequalities in standard or slope-intercept form.
CK-12 Foundation
Mean: Arithmetic Mean
How is a mean affected by changes in data? A well-designed animation allows individuals to manipulate data and watch the effect on the mean. Challenge questions help guide users to conclusions about outliers and skew within data.
Shodor Education Foundation
Regression
How good is the fit? Using an interactive, classmates create a scatter plot of bivariate data and fit their own lines of best fit. The applet allows pupils to display the regression line along with the correlation coefficient. As a final...
NOAA
Understanding El Niño Using Data in the Classroom
Are weather troubles caused by El Nino? An installment of a larger series presents a five-part lesson on El Nino. First, scholars learn to read sea surface temperature maps. Then, they compare them to data on graphs before determining if...
Curated OER
Using Data to Make Graphs: Pretest
In this data worksheet, 5th graders answer multiple choice questions on data and graphs. Students answer 10 multiple choice questions.
Curated OER
Let's Graph It! Pre-Test
For this graphing worksheet, students complete a set of 10 multiple choice questions, clicking on a link to see correct answers or print the page.
Curated OER
Using Data To Make Graphs
In this using data to make graphs worksheet, learners interactively answer 10 multiple choice questions then click to check their answers.
Curated OER
Pictures of Data
In this data worksheet, students look at maps and charts and answer multiple choice questions about them. Students complete 10 questions.
Curated OER
Think Science - Collecting Data
In this data collection worksheet, students collect data about butterflies and milkweed plants and record the measurement tools they use to collect it. Students complete 2 columns.
CK-12 Foundation
Mode: Boxes of Oranges
See how your data stacks up. Pupils stack crates of oranges in increasing order, creating a simple bar graph. Using the graph, individuals determine measures of center and describe the shape of the distribution. Scholars determine what...
CK-12 Foundation
Understand and Create Histograms: Car Sales
Create a history of car sales. Pupils create a histogram/bar graph to show the number of car sales made during the week. Using the data display, learners calculate numerical summaries of the data and find the percent of cars sold during...
CK-12 Foundation
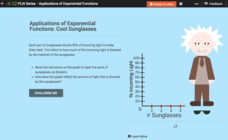
Exponential Decay: Cool Sunglasses
Who wouldn't want to wear four pairs of sunglasses? Each pair of sunglasses reduces the percent of incoming light by one-half. An interactive tutorial helps young mathematicians build a graph that models this scenario. They then explore...
Shodor Education Foundation
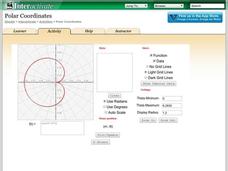
Polar Coordinates
Polar opposites might not work together—but polar coordinates do! The interactive provides learners the opportunity to graph trigonometric and algebraic functions using polar coordinates. The program takes either individual data points...
Laboratory for Atmospheric and Space Physics
Marvelous Martian Mineralogy
Believe it or not ... martian soil does have nutrients needed for plants to survive! An out-of-this-world tutorial moves scholars through an analysis of martian soil to determine its chemical make-up. Pupils analyze reflectivity of...
PBS
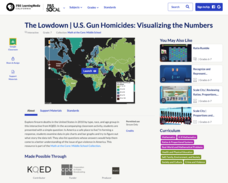
The Lowdown — U.S. Gun Homicides: Visualizing the Numbers
Is gun violence a big issue in America? Pupils explore gun deaths by type, race, and age group in a Math at the Core: Ratios interactive. The class tries to determine whether America is a safe place to live and use bar graphs and pie...
National Academy of Sciences
CO2 and Temperature
Scientists can model global surface temperature with and without considering human emissions, but does do these factors really make a difference? Two interactive graphs demonstrate some factors that affect climate change. The first graph...
Howard Hughes Medical Institute
DNA Sequence Assembly
Oncologists use DNA sequence data to identify specific cancers and offer more targeted treatments. Grasp an understanding of the complexity involved by learning how the body sequences and assembles DNA. Eager scientists explore the...
Shodor Education Foundation
Multiple Linear Regression
You'll have no regrets when you use the perfect lesson to teach regression! An interactive resource has individuals manipulate the slope and y-intercept of a line to match a set of data. Learners practice data sets with both positive and...
Other popular searches
- Data Analysis Graphing
- Graphing and Analyzing Data
- Data and Graphing
- Graphing Data Project
- Collecting and Graphing Data
- Graphing Data in Science
- Collecting Data Graphing
- Organizing and Graphing Data
- Mathematics Graphing Data
- Data Tables and Graphing
- Line Graphing Data
- Graphing Data in Astronomy


