Space Awareness
The Climate in Numbers and Graphs
Weather versus climate: weather relates to short time periods while climate averages the weather of a period of many years. Scholars learn about average temperature and precipitation in various climate zones and then apply statistics...
Curated OER
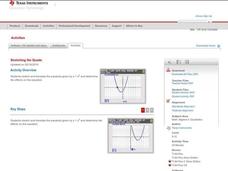
Stretching the Quads
Explore parabolas in this algebra lesson with the graphing calculator. The class investigates what effects the changing of the parameters of the vertex form of a quadrati have to its graph. They find the zeros of a quadratic graphically...
EngageNY
Comparing Rational Expressions
Introduce a new type of function through discovery. Math learners build an understanding of rational expressions by creating tables and graphing the result.
US Department of Commerce
Educational Attainment and Marriage Age - Testing a Correlation Coefficient's Significance
Do women with college degrees get married later? Using a provided scatter plot of the percentage of women who earn bachelor's degrees and the median age at which women first get married over time, pupils conduct a linear regression...
CK-12 Foundation
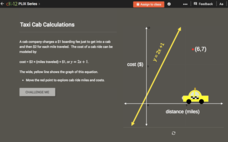
Checking Solutions to Equations: Taxi Cab Calculations
Ride to success in checking solutions to equations. Scholars use an interactive graph to identify points that are solutions to a linear equation. Interpreting these points in terms of the context completes the activity.
Curated OER
Conic Sections
Students, while using a graphing calculator, graph systems of conic sections as well as identify their solutions. They complete various word problems dealing with conic sections with their calculators. In addition, students sketch graphs...
Curated OER
Temperature Bar Graph
Students explore mean, median and mode. In this math lesson, students analyze temperature data and figure the mean, median, and mode of the data. Students graph the data in a bar graph.
Curated OER
Drawing a Triangle with Cabri Junior
Learners draw triangles on their graphing calculators using the Cabri Junior application. For this graphing calculator lesson, students follow step by step directions to create triangles on their calculator. They identify the type of...
Curated OER
Census Statistics and Graphing
Students graphically represent data from the Census. In this middle school mathematics lesson, students investigate the housing characteristics of different tribes of Native Americans and compare them to the average American...
Curated OER
The Circle Graph
In this circle graph worksheet, students complete problems involving many circle graphs including a compass rose, degrees, and more. Students complete 7 activities.
Texas Instruments
2B or not 2B a Functions
Learners use their graphing calculators to view graphs of equations. They tell if each equations is or is not a function and are shown pre-set graphs on their graphing calculators. They use the Quick Poll feature to indicate if the graph...
Curated OER
Graphing and Interpreting Linear Equations in Two Variables
Graph linear equations using a table of values. Learners solve equations in two variables using standard form of an equation. They identify the relationship between x and y values.
Curated OER
Digger and the Gang
Help online friends Digger and Sprat from the BBC series to solve math problems! In a series of activities, your class will use data sets to calculate measurements, averages, means, and probabilities. The class completes worksheets and...
Curated OER
Sweet Data
Students input data about the colors of their serving of M&M candies onto a spreadsheet. They create charts and graphs based on this information.
Curated OER
Fire!, Probability, and Chaos
Upper elementary and middle schoolers work with the concept of probability. They are introduced to the concept of chaos. Learners graph and analyze using a line plot, work with mean, and are introduced to the concept of variance.
Curated OER
What is the Average Height of Your Class?
In this statistics lesson, learners use an on-line form generator create a class-specific form, then complete the form, view a graph and data analysis, and draw conclusions.
Curated OER
Tides at the Battery, NY
Skill in using Excel and increasing proficiency in manipulating data are challenged with this data analysis work. A web link supplies data and step-by-step instructions help learners create a graph. There are many extension...
Curated OER
Classroom Supplies
Challenge young mathematicians to buy classroom supplies by staying within the means of a $1,000 budget. The mathematical activity provides learners with the opportunity to decide what items from the supply list would benefit a class of...
PBL Pathways
Potassium-Argon Dating
Find the age of a fictional sample of rocks using a genuine approach. A well-designed lesson asks young mathematicians to use exponential modeling to analyze half-life. As a project-based learning activity, scholars communicate...
Curated OER
Velocity of Traffic on Highway 26
Physics fanatics time five cars as they pass on the highway. They use the times and a 20-yard distance to calculate velocity. They also graph distance vs. time. A page of student pre-lab questions is provided in addition to the activity...
Teachers Network
A World of Symmetry: Math-Geometry
Define and identify the three basic forms of symmetry translation, rotation, and glides with your class. They cut out and arrange paper pattern blocks to illustrate symmetry, create a Cartesian graph, and design a rug with a symmetrical...
Mathalicious
Domino Effect
Carryout the lesson plan to determine the cost of pizza toppings from a Domino's Pizza® website while creating a linear model. Learners look through real data—and even create their own pizza—to determine the cost of each topping....
Curated OER
Systems of Linear Equations
Introduce the inverse matrix method to solve systems of linear equations both algebraically and graphically. Using given data, your class checks their answers with graphing calculators. Handouts are included in this well-thought out lesson.
Federal Reserve Bank
FRED in the Classroom: Measures of Inflation
Don't just tell class members about how to measure inflation, have them experience it firsthand by asking them to work with real data and construct graphs!

