Curated OER
Stick-Slip Movement
Ninth graders operate a model to observe the type of motion that occurs at a fault during an earthquake. They explore the effects of several variables. Students measure movement, calculate averages and plot and graph information.
Curated OER
Investigation- What Does It Cost?
Eighth graders investigate percents by comparing different discounts on the same sale item, practice graphing percents, and look at reasonable and unreasonable "percents off" a sale item.
Curated OER
Capture/Recapture
Students use proportions to estimate the size of populations. They describe the data with using a graph or table of the estimate. Students use descriptive statistics to calculate mean, median, and mode. They also compare and contrast an...
Curated OER
Factoring and Solving Quadratics Self-Test
This learning exercise provides good practice of factoring expressions and solving quadratic equations by factoring. It also includes a word problem and graphing an equation using a calculator. This one-page learning exercise contains 17...
Curated OER
Fishing for Points
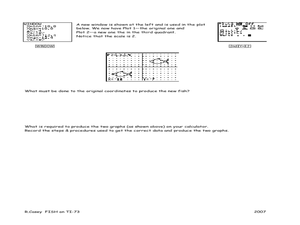
Learners explore the concept of ordered pairs. In this ordered pairs lesson plan, pupils list the ordered pairs of a graph in the shape of a fish. They use their calculator to translate the fish using lists, then translate the fish left,...
Curated OER
Discovering Ohm's Law
Connect math with science! Pupils apply properties of Ohms Law as they solve problems and identify the inverse relationship of a function. They analyze the shape of the graph of an inverse function and use it to make predictions.
Alcohol Education Trust
Talk About Alcohol: How Much Alcohol is in a Drink?
Introduce your class to alcohol content. In order to become aware of the varying strengths of alcoholic drinks, class members complete a chart and plot a bar chart with the results. They make observations about the results.
Curated OER
Take Your Medicine 2
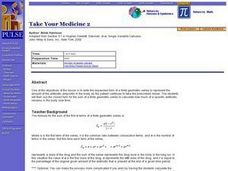
Real-world application of the finite geometric series. Sick? Need to take Ampicillin? How much is in the body at any given point in time as this medication is taken over the course of time. Use the formulas, make calculation, and graph...
Curated OER
Gradients of Parallel Line Segments
In this gradient worksheet, students draw line segments and determine if they are parallel. They plot points on a coordinate plane and calculate the gradient of each created line. This five-page worksheet contains 8 multi-step problems....
Curated OER
Excel Lesson
Students explore data and Excel spreadsheets. They collect data about political candidates. Students enter the data into a chart on Excel. They create a graph using the data and Excel.
Curated OER
Types of Functions and Composition of Functions
Algebra II classes solve problems relating to piecewise functions, step functions, and decomposition/composition of functions. They utilize links to work with real world examples. Mr. Pleacher has added humor to the lesson by including...
Curated OER
Buying a Car
Eighth graders create spreadsheets to calculate payments. They create a list of items they would like to purchase that require monthly payments. They simulate buying a car and create a spreadsheet to determine the amount of the monthly...
Curated OER
Count on Me
Fourth graders use inductive reasoning to find algebraic patterns in geometric figures. They use technology (i.e., calculators, computers) and manipulatives to discover number patterns involving geometric concepts. They solve concrete...
Curated OER
Problem Solving Strategies: Patterns
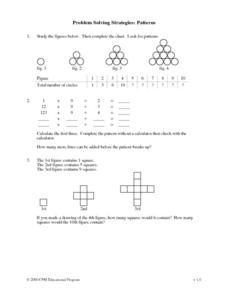
What's next in the series? Mathematicians study figures, graphs, and statements to determine what comes next in this patterns worksheet. They experiment with a multiplication chart and draw their own figures to continue specific...
Curated OER
Penny Pushing
Fifth graders use an Excel spreadsheet to show them how to enter the amount of pennies they bring each week to school for a fundraising project. They count their pennies each Friday and enter the total amount in the correct columns. In...
Curated OER
Two-Variable Linear Inequalities
Here is an engaging lesson plan on solving equations with two variables. Have the class rewrite linear equations in the slope intercept form, y=mx + b. They graph the lines using the slope and y-intercepts.
Curated OER
A Look At Rocks
Students write letters to organizations, such as United States Geological Society, to find out more about rocks. Students write about a pretend time they found a magic pebble. Students calculate distances to travel to see various...
Curated OER
See Turtles Nest! See Turtles Hatch!
Students graph data of sea turtles hatching rates from Watamu/Malindi Marine National Park and Reserve in Kenya. In this math lesson, students use real life science data to calculate mean and median values. Students use the data to...
Curated OER
Devising a Measure for Correlation
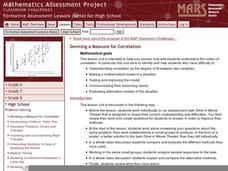
How well does your class understand the concept of correlation? Use an activity to explore different methods of calculating correlation. Working alone and then in groups, your class will make decisions on what math to apply to the...
Curated OER
Frame Yourself
Young ratio masters calculate and cut a frame (out of poster board) to accurately create an even frame around a picture of themselves. The frame needs to be proportional to the picture with constraints determined by the instructor.
Curated OER
Old Glory
Students utilize mathematical concepts such as: measurement, ratio and proportion and geometric probability to analyze the components of the U.S. Flag. They collect, organize and interpret data by constructing charts, tables and graphs...
Curated OER
Differential Equations
In this differential equations instructional activity, students solve and complete 3 different parts of a problem. First, they sketch a slope field for the given differential equation on the axes provided. Then, students write an...
WindWise Education
What Factors Influence Offshore Wind?
What is that out in the water on the horizon? Teams work together to study the coastline using maps to determine the best and worst locations to place an offshore wind farm. The teams then build a scale model wind farm to see what it...
Curated OER
Louisville's Best Field Day Park
Students create a survey to hand out to determine the best field day park. Using their local area, they select five parks, if possible, that meet the criteria and calculate the distance and estimated time travel. They use this...
Other popular searches
- Graphing Calculator and Math
- Algebra Graphing Calculators
- Graphing Calculator Math
- Graphing Calculator Skills
- Graphing Calculator Squares
- Graphing Calculator Lessons
- Graphing Calculator Parabola
- Graphing Calculators Ti 83
- Graphing Calculator Activities
- Graphing Calculator Worksheet
- Ti 84 Graphing Calculator


