Curated OER
Map the Civil War
Students explore the Civil War through original maps. For this mapping lesson, students calculate distance and show it on an original map. Students examine the type of landscape and its landmarks and draw symbols on the map.
Curated OER
Lessons for Atlatl Users with Some Experience-Grade 5
Fifth graders throw darts, collecting data for distance traveled. In this data analysis lesson, 5th graders throw a dart using an atlatl. They calculate the speed for each throw and determine the best dart length for distance throws.
Curated OER
Kids Conserve? Water Preserved
Sixth graders review the steps of the water cycle. Individually, they calculate the amount of water they use in a day and identify ways they can conserve. As a class, they discuss how conserving water today helps future generations and...
Council for Economic Education
FRED and the Federal Budget Interactive Lesson
How can a federal debt accumulate over time? The Federal Reserve Economic Data (FRED) dashboard allows scholars to actively research each aspect of the federal budget. In pairs, they analyze economic data to determine the best way to...
Curated OER
College Education
What do Bill Gates and Mark Zuckerberg have in common? They're both billionaires, and neither one has a college degree! Using the website, scholars explore whether having a college education is truly worth the money it costs. They read...
Curated OER
Multiplying Matrices for Fun and Profit
Students explore matrix multiplication to generate new data. In this pre-algebra lesson, students solve problems by computing with matrices. Students explore the concept of matrices in the real-world context of running an ice cream store.
Curated OER
How Can Entrepreneurs Control Costs?
Young scholars calculate fixed and variable costs. In this costs lesson, students read a case study about an entrepreneur and her business costs. Individuals complete the provided worksheets to find costs and make related business...
Curated OER
Real Estate Lesson: Monthly Payments
Students examine real-world data relating to real estate. They conduct Internet research, record data regarding real estate in major cities, graph the data, calculate mortgage payments using a mortgage calculator, and analyze the data.
Curated OER
Spreadsheets and Database in Social Studies
Fifth graders create/use spreadsheets to solve real-world problems, explore patterns and make predictions, select/explain most appropriate types of graph to display data, and enter data into a prepared spreadsheet to perform calculations.
Curated OER
Archaeology Vocabulary Sampling
Students predict how many words out of ten they accurately define. They match the definitions to the correct vocabulary words and make a bar graph showing how many definitions were matched to the correct words. The write their group...
Curated OER
World Population Study
Students explore an exponential relationship and how it relates to human population growth and the current global population crisis. They graph both exponential and linear information.
Curated OER
Planning My Vacation Online
Students use a variety of resources to decide on a vacation destination. They locate three points of interest, a hotel, and two restaurants at their destination.Students obtain driving directions for their trip, create a trip budget, and...
Curated OER
Global Statistics
Students select appropriate data to determine the mean, median, mode and range of a set of data. They calculate the statistical data on literacy rates and life expectancy within each geographic region of the world. Students determine...
Curated OER
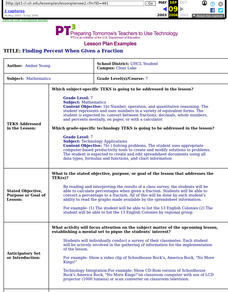
Finding Percent When Given A Fraction
Seventh graders calculate percentages when given a fraction. They convert a percentage to a fraction. All of this be done by each student's ability to read the graphs made available by the spreadsheet information.
Curated OER
Book: Latinos Today: Facts and Figures
Students, after reading Chapter 1 in the book, "Latinos Today: Facts and Figures," identify and characterize the four main ethnic/racial groups in America. They calculate and design a bar graph showing their populations by their...
Curated OER
Choose or Lose: The Electoral Process
Pupils examine the local and national election process. In groups, they brainstorm a list of the issues important to them and compare them to an overall list of issues present in the election. They analyze graphs and complete...
Curated OER
Rainforest Data
In this geography worksheet, students use the climate data given to create a temperature line graph and rainfall bar graph for each of three locations given. Then they use an atlas to compare their graphs and draw conclusions about the...
Curated OER
Sunrise, Sunset: Quickly Go the Days
Learners explore the concept of daylight. In this daylight lesson, students compare the amount of daylight on a particular day in Anchorage compared with daylight where they live. Learners color maps of the US according to amount of...
Curated OER
Effects of Temperature, Deviation on Climate
Students collect and record data for a given city. They calculate standard deviation of temperature and analyze the impact of climate changes on a city's and culture.
Curated OER
Holidays Around the World
Students use the internet to gather information about holidays around the world. They create a calendar with all of the holidays outlined and calculate the percentages of countries who celebrate each one. They design a greeting card to...
Curated OER
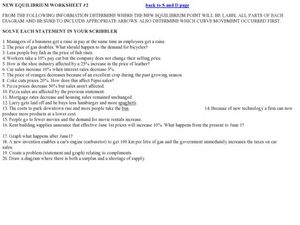
New Equilibrium Worksheet
In this economics practice worksheet, students respond to 20 questions where they calculate new equilibrium points and label diagrams.
Curated OER
Human Ecology: How it Relates to Population
Ninth graders are introduced to the concept of population. In groups, they research the problems associated with overpopulation and underpopulation. They practice calculating birth and death rates and discus how they can be used to...
Curated OER
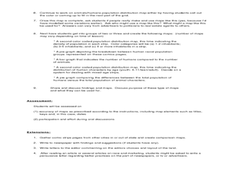
What is the Population Distribution of Cartoon Characters Living On the Pages of Your Newspaper?
Students read various cartoons in their local newspaper and calculate the population demographics, spatial distribution and grouping of the characters. Using this information, they create a population distribution map and share them with...
Curated OER
Economics Worksheet: Opportunity Costs
In this economics worksheet, students use their problem solving skills to calculate opportunity costs and graph their calculations.
Other popular searches
- Graphing Calculator and Math
- Algebra Graphing Calculators
- Graphing Calculator Math
- Graphing Calculator Skills
- Graphing Calculator Squares
- Graphing Calculator Lessons
- Graphing Calculator Parabola
- Graphing Calculators Ti 83
- Graphing Calculator Activities
- Graphing Calculator Worksheet
- Ti 84 Graphing Calculator


