Inside Mathematics
Graphs (2007)
Challenge the class to utilize their knowledge of linear and quadratic functions to determine the intersection of the parent quadratic graph and linear proportional graphs. Using the pattern for the solutions, individuals develop a...
Inside Mathematics
Graphs (2004)
Show your pupils that perimeter is linear and area is quadratic in nature with a short assessment task that requests learners to connect the graph and equation to a description about perimeter or area. Scholars then provide a...
Physics Classroom
Position-Time Graphs - Conceptual Analysis
Increasingly, colleges and employers want applicants with strong conceptual analysis skills, so give them some practice! Applying these skills to position-time graphs encourages synthesis of knowledge. To complete an installment of a...
Curated OER
Double Bar Graphs - Homework 7.1
Your learners have seen basic bar graphs, but do they have experience reading double bar graphs? This worksheet details how to draw a double bar graph and provides an example with six accompanying questions. The final question asks...
Curated OER
Interpreting A Line Graph - Practice Problems 15.3
For this interpreting a line graph worksheet, students read a graph and answer a question. Students are taken through the problem solving process by being asked to understand, plan, solve and look back at the end of the worksheet and...
Teach Engineering
Applications of Linear Functions
It's not so straightforward — lines can model a variety of applications. Pupils experience linear relationships within the context of science, including Hooke's and Ohm's Laws. Class members got a taste of motion and speed from the...
Curated OER
Exploring Quadratic Data : Transformation Graphing
High schoolers analyze the vertex form of a parabola and find an approximate fit of a model. They explain the quadratic parabola function and its properties by developing quadratic models. They use translation and dilation to change the...
Curated OER
Graphing Difference
Students use problem solving skills to reason, predict and problem solve through exploration. They recognize a way in which they are different from their peers and create a graph that shows these differences.
Curated OER
Application of Linear Systems
Let the learners take the driving wheel! The class solves systems of linear equations and applies the concepts of systems to solve a real-world situation about parking cars and buses. They then use calculators to create a visual of their...
Computer Science Unplugged
The Poor Cartographer—Graph Coloring
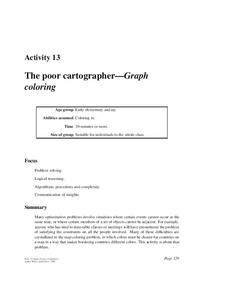
Color the town red. Demonstrate the concept of graph theory with a task that involves determining the least number of colors needed to color a map so that neighboring countries are not represented by the same color. Pupils make...
Curated OER
Analyzing Equations Through Slope and Y-int
With problems applying to modern-day topics like Netflix and McDonald's, math whizzes analyze graphs and investigate the slopes. For this algebra worksheet, learners identify the slope and y-intercept of the given equations. They graph...
Natinal Math + Science Initative
Slope Investigation
Context is the key to understanding slope. A real-world application of slope uses a weight loss scenario with a constant rate of change to introduce the concept of slope of a line, before it makes a connection to the ordered pairs and...
Teach Engineering
Matching the Motion
It is not always easy to walk the straight and narrow. In the sixth portion of a nine-part unit, groups actively recreate a graph depicting motion. Individuals walk toward or away from a motion detector while trying to match a given...
Shodor Education Foundation
Function Flyer
Fly through graphing functions with the Function Flyer. Young mathematicians use an interactive to graph different types of functions. A set of exploration questions has users investigate patterns in functions.
NASA
Ascent: 50 Seconds to MECO
All systems go! With a video and a Google Earth tour as background, pairs investigate two graphs. The graphs display acceleration vs. time and velocity vs. time of a space shuttle launch. Using graphing calculators, the pairs take a...
NASA
Weightless Wonder
A video of the weightless wonder provides a setting for the math to follow. Groups analyze the graph of a quadratic function that models the path of the C-9 as it gives astronauts the experience of weightlessness. Using a graphing...
Shodor Education Foundation
Graphit
No graphing calculator? No worries, there's an app for that! Young mathematicians use an app to graph functions. In addition, they can also plot data points.
Illustrative Mathematics
Foxes and Rabbits 3
Model periodic populations. Here, in the context of foxes and rabbits, pupils look at graphs of the populations of these animals in a national park over a span of 24 months. Groups analyze the graphs and determine trigonometric functions...
Shodor Education Foundation
Possible or Not?
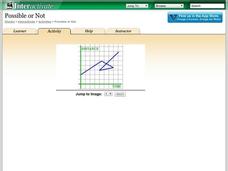
What does the graph mean? Pupils view 10 graphs and determine whether they are possible based on their contexts. The contexts are distance versus time and profit versus time.
Radford University
Transformational Graphing in the Real World: Air Traffic Control
You're cleared to learn about absolute value functions. An interesting lesson has scholars investigate transformations of the graphs of absolute value functions. They look at air traffic control as an application of the concept.
Flipped Math
Calculus AB/BC Unit 5 Review: Analytical Applications of Differentiation
Time to put it all together in one sheet—well five. Pupils review all the topics presented in the resources for Analytical Applications of Differentiation. The five pages summarize the concepts with explanations and examples.
Curated OER
Application of Graph Theory
Students investigate different online tutorials as they study graphing. For this graphing lesson, students apply the concept of graphs cross curricular and use it to make predictions. They define the purpose and theories behind graphs.
Curated OER
Problem Solving Application: Using Circle Graphs
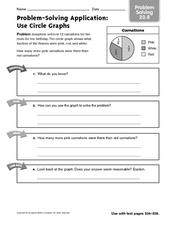
In graphing worksheet, 4th graders use the information from a circle graph about carnation sales to complete the steps of problem solving. They determine what they know, and how they can use the graph. They find how many more pink...
Curated OER
Problem-Solving Application: Make a Circle Graph
In this circle graphs worksheet, students analyze a data table about the activities in a day. Students then use this data to make a circle graph. Students answer 6 questions about the graph.


