Benjamin Franklin High School
Saxon Math: Algebra 2 (Section 4)
This fourth of twelve units in a series continues the investigation of functions through equations and inequalities. However, the modular nature of the lessons in the section make this an excellent resource for any curriculum...
Curated OER
Connecting Algebra and Geometry Through Coordinates
This unit on connecting algebra and geometry covers a number of topics including worksheets on the distance formula, finding the perimeter and area of polynomials, the slope formula, parallel and perpendicular lines, parallelograms,...
Curated OER
Describing Data
Your learners will practice many ways of describing data using coordinate algebra in this unit written to address many Common Core State Standards. Simple examples of different ways to organize data are shared and then practice problems...
Mathematics Vision Project
Module 6: Congruence, Construction, and Proof
Trace the links between a variety of math concepts in this far-reaching unit. Ideas that seem very different on the outset (like the distance formula and rigid transformations) come together in very natural and logical ways. This...
Khan Academy
Khan Academy: Graph From Slope Intercept Form
Practice drawing the graph of a line given in slope-intercept form. For example, graph y = 3x + 2. Students receive immediate feedback and have the opportunity to try questions repeatedly, watch a video or receive hints.
Texas A&M University
Wtamu Virtual Math Lab: College Algebra: Graphing Lines
Complete this tutorial to learn how to graph a straight line if given the y-intercept and slope and how to graph horizontal and vertical lines. View examples of lines with different slopes, and practice working with slope-intercept form.
Texas Education Agency
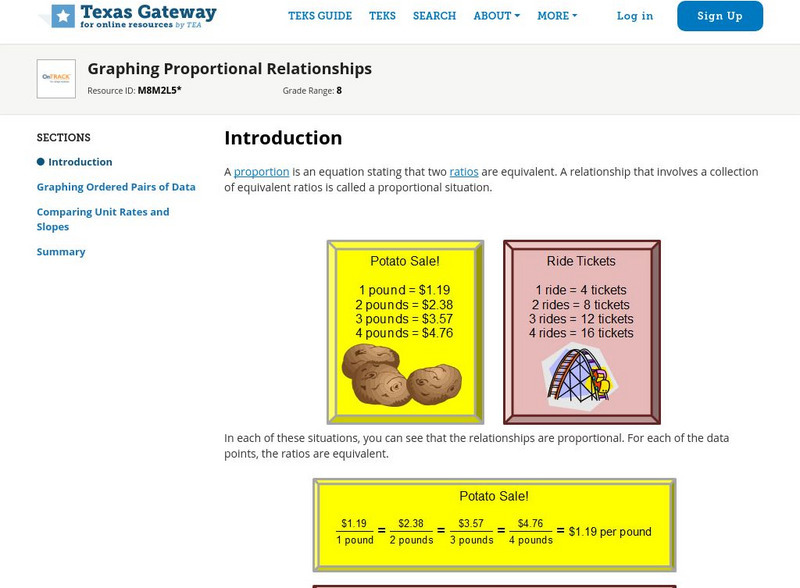
Texas Gateway: Graphing Proportional Relationships
Given a proportional relationship, students will be able to graph a set of data from the relationship and interpret the unit rate as the slope of the line.
CK-12 Foundation
Ck 12: Graphing
[Free Registration/Login may be required to access all resource tools.] Given a set of data, students will understand how to correctly draw a line or bar graph, interpret its patterns, and find the slope in the case of a line graph.
Texas A&M University
Wtamu Virtual Math Lab: College Algebra: Parallel and Perpendicular Lines
Given a line, learn how to find the equations for lines that are perpendicular and parallel to it. This tutorial offers several example graphs and problems as well as practice problems for you to work through when you're ready.
PBS
Pbs: The Lowdown: What You Need to Know About Immigration Reform
Interpret graphs showing changes over time in the percentage of foreign-born US residents and in annual deportations in this interactive from KQED. In the accompanying classroom activity, students use the interactive and look at how...


