Curated OER
Graphing Functions With 2 Points and From a Graph
Students plot points on a coordinate plane. They describe, in words, methods for finding the slope of a line. After given a worksheet, students read instructions, draw a Cartesian plane, plot ordered pairs, and graph lines. Papers are...
Curated OER
The Slope of a Curve
Pupils graph the slopes of a line using the intercepts. In this precalculus lesson, students identify the properties of a curve slope. They find the limit and use a graping calculator to graph their lines.
Curated OER
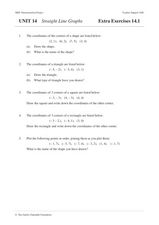
Straight Line Graphs
In this math instructional activity, students plot lines on a graph paper when given the equation for the line in slope-intercept form. They tell the values of the slope and the y-intercept. Students find the x and y intercepts and plot...
Curated OER
Graphing Linear Equations with Calculator
Students graph lines using the calculator. In this algebra lesson, students graph lines of equations in the form y=mx+b. They input equations into the TI Calculator and graph using the slope and intercept. They analyze the graph for...
Curated OER
Identifying Positive, Negative Slope of Neither
In this linear slope activity, students determine whether the slopes of four graphed lines are positive, negative, or neither. Solutions are provided.
Curated OER
Graphing Inequalities and Shading
Students graph and shade inequalities. In this algebra instructional activity, students graph inequalities using the slope-intercept form. They shade the side of the line that is the solution and identify the domain and range.
Curated OER
Graph a Situation Without a Table
Students graph an equation without a table. In this algebra activity, students are given rate or time and asked to graph a line at the starting rate. They use the slope intercept form to decipher the word problem and graph the line.
Curated OER
Point-Slope Form
Ninth graders explore the point-slope form of linear equations and graph lines in the point-slope form. After completing the point-slope equation, they identify the slope of a line through a particular point. Students explain the...
Curated OER
Slippery Slope
Students define patterns, relation and function. In this algebra lesson, students find the slope of a line and write equations of line. They model the slope using real life scenarios.
Curated OER
Linear Equations and Their Graphs
In this Algebra I/Algebra II learning exercise, students solve problems involving interpreting the slope of a linear equation as a rate of change. The two page learning exercise contains a combination of seven multiple choice and...
Curated OER
Juggling Slopes
Students identify the slope of a line. In this algebra lesson, students label slopes as positive, negative, zero or undefined. They use the slope formula to find the slope algebraically and graphically.
Curated OER
What is an Antiderivative? Slope Fields
Learners take the derivative of a function. In this calculus instructional activity, students define slope fields and what they are used for. They relate slope fields to the real world.
Curated OER
Graphs in the Coordinate Plane
In this equations worksheet, students complete 13 multiple choice questions matching a graph in the coordinate plane to its equation and writing the equation of a line given two points or slope and a point.
Curated OER
Graphing Linear Equations and Inequalities
Students discuss methods to solve equations and inequalities with one variable. As a review, they write Addition and Subtraction properties of equality and Multiplication and Division properties of equality. Students graph points, write...
Concord Consortium
Shooting Arrows through a Hoop
The slope makes a difference. Given an equation of a circle and point, scholars determine the relationship of the slope of a line through the point and the number of intersections with the circle. After graphing the relationship, pupils...
EngageNY
Searching a Region in the Plane
Programming a robot is a mathematical task! The activity asks learners to examine the process of programming a robot to vacuum a room. They use a coordinate plane to model the room, write equations to represent movement, determine the...
Balanced Assessment
On Averages and Curves
Determine the average on a curve. The class finds graphical representations of averages and expresses them both symbolically and on the graph. The assessment requires class members to justify using average to describe graphs.
American Statistical Association
Scatter It! (Predict Billy’s Height)
How do doctors predict a child's future height? Scholars use one case study to determine the height of a child two years into the future. They graph the given data, determine the line of best fit, and use that to estimate the height in...
West Contra Costa Unified School District
Average Rate of Change
Learners investigate average rates of change for linear functions and connect the concept to slope. They then determine average rates of change in quadratic and exponential functions.
Curated OER
Buses
Busy buses bustling back and forth. In this middle school assessment task, learners use information given in a graph to answer questions about bus schedules. They then determine how many times a bus passes by other buses going in the...
Concord Consortium
Betweenness I
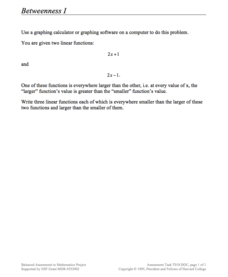
Just between us, this is a pretty cool lesson! Given two functions with the same slope, learners write three new functions whose outputs are all between the given functions. The question is open-ended, allowing pupils to explore the...
EngageNY
Segments That Meet at Right Angles
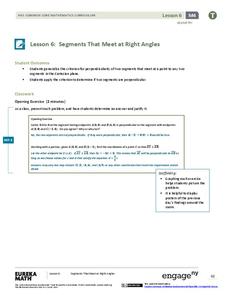
Can segments be considered perpendicular if they don't intersect? Learners look at nonintersecting segments on the coordinate plane and make conclusions about the lines that contain those segments. They determine if they are...
Curated OER
Chapter 2.3 - Slope
In this slope activity, students answer 16 slope intercept questions. They determine slopes based on equations, graphs and coordinates. Students also find the equations of lines parallel and perpendicular to a given line and that goes...
Curated OER
Writing Linear Equations in Slope-Intercept Form
For this math worksheet, young scholars are given three lines graphed on a coordinate grid. Students identify the slope, intercepts, and write an equation for each. Young scholars find the intercepts of a linear equation, and graph them....


