Curated OER
The Big Bang-Hubble's Law
In this Hubble's law worksheet, students use data for galaxies which include their distance and speed. Students make a graph to show the distance to each galaxy and the speed of each galaxy. They use their graph to answer 4 questions...
Curated OER
Forms of Equations
Ninth graders discuss the different forms of equations. For this algebra lesson, 9th graders talk about the pros and cons of algebraic equations. They discuss reflection across the x and y axis and write out the equation of the given...
Curated OER
Exploring The Depths!
Fifth graders make a model of the ocean floor. In this ocean characteristics lesson plan, 5th graders complete a KWL chart about the ocean floor, use the Ocean Depth Data Sheet to create a graph, and create a 3-D model of the ocean...
Curated OER
Be the Kiwi
Students analyze linear equation. In this algebra lesson, students analyze and graph data. They solve problems involving linear equations and graph lines using the slope and y intercept.
Curated OER
Latent Heat of Fusion
Students conduct a series of investigation on latent heat of fusion. In this chemistry instructional activity, students explain how thermal storage systems work. They draw and interpret graphs.
Curated OER
Medians and Altitudes of Triangles
In this geometry worksheet, 10th graders determine if a given segment is a median or altitude of a triangle and use then find the indicated missing length or equation of a line. The two page worksheet contains twenty...
Curated OER
Linear Motion 3
In this linear motion worksheet, learners answer 11 questions including finding acceleration of moving objects, finding the distance objects travel and finding the time it takes objects to move a particular distance. Students interpret...
Curated OER
Linear and Exponential Models
High schoolers investigate the differences between linear and exponential models. In this linear and exponential models activity, students make a table of given data. High schoolers determine if the data is linear or...
Curated OER
Triangles Inscribed in a Circle
Are you tired of answers without understanding? Learners can give a correct response, but do they really understand the concept? Have young mathematicians think deeper about linear functions, angles, and formulas in algebra....
Mathematics Vision Project
Module 6: Congruence, Construction, and Proof
Trace the links between a variety of math concepts in this far-reaching unit. Ideas that seem very different on the outset (like the distance formula and rigid transformations) come together in very natural and logical ways. This...
EngageNY
Nonlinear Models in a Data Context
How well does your garden grow? Model the growth of dahlias with nonlinear functions. In the instructional activity, scholars build on their understanding of mathematical models with nonlinear models. They look at dahlias growing in...
Curated OER
Writing Linear Equations
Students rewrite word problems using algebraic symbols. In this algebra lesson, students write linear equations using the slope and y intercept. They write equations given two points that are on the line.
Curated OER
Writing Equations
Students write linear equations. In this algebra lesson, students are given information and asked to write an equation. They solve real world problems apply concepts of linear equations.
Curated OER
Price of Apples- Linear Data
Students collect data and create a graph. In this algebra lesson, students describe functions graphically, algebraically and verbally. They identify functions as being independent and dependent using variables.
Curated OER
Epidemic or False Alert?
In this rate instructional activity, students use the SIR model to determine if a disease is spreading at an epidemic rate. They find the slope of a curve and the slope of a line that goes through a given point. This two-page...
Curated OER
Relating Distance and Velocity Over Time
Students calculate the distance and velocity over time. In this algebra lesson, students graph a linear function to represent the distance vers time travel. They interpret their graphs and draw conclusion.
Curated OER
Choosing a Summer Job
What did you do over your summer vacation. Young wage earners must compare summer job options, and determine when each job earn the same amount and what that amount be. This be done by creating, graphing, and solving systems of...
Curated OER
Solving Systems of Linear Equations Graphically
Students solve systems of equations graphically. For this algebra lesson, students find the point of intersection of two lines if they are not parallel. They rewrite the equation in the y=mx + b form and graph using slope and intercept.
Curated OER
The Definition Derivative
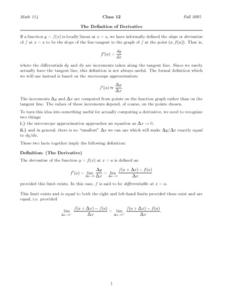
In this derivative worksheet, students evaluate limits, factor equations, and calculate the given function. They determine the derivative of a function and plot it on a graph. This four-page worksheet contains eight problems.
Curated OER
Describing the Motion of a Battery Powered Cars
Students explore distance a toy car travels by changing the amount of batteries used to power the toy car. In this force and motion lesson, students calculate the average speed of a car while investigating the power from various...
Curated OER
Real World Systems of Linear Equations
Students solve systems of equations with fluency. In this algebra lesson, students graph, use elimination and substitution to solve systems of equations. They identify the point of intersection using algebra.
Curated OER
Euler's Method
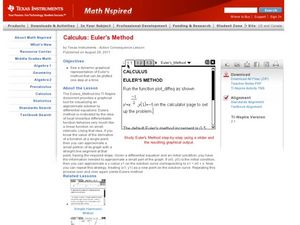
Learners identify Euler's method of graphing in this calculus lesson. They approximate values of a function and check their work using EM. They also differentiate equations at an exact point.
Curated OER
My Peanut Butter is Better Than Yours!
Learners explore the concept of statistical data. In this statistical data lesson, students read an article about the dangers of peanut butter to those who are allergic. Learners perform a taste test of two different brands of peanut...
Curated OER
Lesson Plan On Fran Data
Seventh graders investigate the concept of functions and how they are used in the context of the real world while identifying the dependent and independent variables. They graph relations and functions and find the zeros of functions....

