Curated OER
Viewing Tubes
Students complete a lab in order to discover if the length of a viewing tube, its diameter, or the distance from an object affect the type of data collected and the resulting graph.
Curated OER
Mobile vs. Money
Young scholars research the internet and use the information they find to plot straight line graphs. They use graphs to make comparisons of the various packages offered. Students interpret graphs and solve problems based on varying...
Math Worksheet Center
Linear Quadratic Systems
In this linear quadratic system worksheet, learners explore a system with a linear and a quadratic equation. With the given equations, students graph the parabola. They identify the axis of symmetry, the slope, points of intersection,...
Curated OER
Linear Equations
In this linear equations instructional activity, learners solve 9 different linear equations by applying the point-slope formula in each. First, they determine the linear equation of each. Then, students use the slope and one point of...
Curated OER
Linear Equations
Pre-algebra pupils examine the rate of change and how we can interpret it as a linear function. They are introduced to slope-intercept equations and graphs. Plenty of instruction is provided along with example problems. Note that even...
Curated OER
Fitting a Line to Data
Students work together in groups to collect data in relationship to how much water marbles can displace. After the experiment, they use the data to identify the linear equation to determine the best-fit line. They use the equation to...
Curated OER
Obstacles to Success: Misleading Data
Eleventh graders explore how data reported by country agencies can mislead the public intentionally or unintentionally. In this Cross Curricular activity, 11th graders analyze charts and graphs in order to draw conclusions. Students...
Curated OER
Worksheet 17: Writing Equations
In this equations worksheet, students graph the curve represented by pairs of parametric equations. They determine the slope of the line tangent to a given graph. Students find the area region lying under the curve. This two-page...
Charleston School District
Solving Systems by Inspection
Can you solve a system by just looking at it? The previous lessons in the series taught three methods of solving systems of equations. Now learners discover they can determine the number of solutions of a system just by looking at it....
West Contra Costa Unified School District
Introduction to Inverse Functions
Ready to share the beauty of the inverse function with your classes? This algebra II lesson guides the discovery of an inverse function through a numerical, graphical, and an algebraic approach. Connections are made between the three,...
Mathalicious
Domino Effect
Carryout the instructional activity to determine the cost of pizza toppings from a Domino's Pizza® website while creating a linear model. Learners look through real data—and even create their own pizza—to determine the cost of each...
Curated OER
Algebra 1
Students study the functional relationships of a variety of problems. In this functional relationship activity, students determine the dependent and independent quantities of a given set of data. Students record the data and...
Curated OER
Using Linear Models
In this Algebra II worksheet, 11th graders examine models whose behavior can be described by a linear function. The four page worksheet contains explanation of topic, three guided problems, and eight practice problems. ...
Curated OER
Review of Linear Equations
In this algebra instructional activity, students solve linear equations and rewrite them in the form y=mx + b. They graph the equations using the slope and y-intercept. There are 22 questions with an answer key.
Curated OER
Solving Systems of Equations
Learners identify the quadrants and axis of a coordinate plane. In this algebra lesson, students discover the ocrrect way to graph using the coordinate plane. They discuss the relationship between x and y values, domain and range and...
Curated OER
Writing Linear Equations
In this algebra instructional activity,students solve linear equations and graph their answers on a number line. There are 24 questions with an answer key.
Curated OER
Walking Home II
Students explore the relationship between distance and time. They analyze a situation involving distance traveled in a given period of time, represent the situation graphically and algebraically, and discuss the concept of slope as a...
Curated OER
Coordinates and Equations
In this algebra worksheet, students solve linear equations and plot their results on the coordinate plane. There are 20 problems using slopes and intercepts to help graph linear equations.
Curated OER
Describing Data
Your learners will practice many ways of describing data using coordinate algebra in this unit written to address many Common Core State Standards. Simple examples of different ways to organize data are shared and then practice problems...
Texas Instruments
Mean Value Theorem
Students calculate the slopes of secant lines. In this calculus lesson, students graph tangent and secant lines using the coordinate plane. They use the Ti calculator to graph and observe the lines.
Curated OER
Calculus Practice Exam
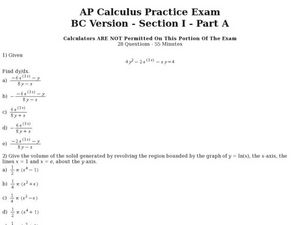
In this calculus instructional activity, students practice solving problems that will be on their calculus exam. They evaluate, take the derivative and find the slope of a tangent line. There are 28 questions.
Curated OER
Intro to Derivatives
In this calculus worksheet, learners find the line tangent to a curve using the derivative. They graph the slope and identify the line of tangency. There are 6 questions.
Curated OER
Calculus Practice BC
In this calculus worksheet, students solve functions using the derivatives. They calculate the volume where the graph is revolving around the x-axis, a line, the y-axis and where x=e. There are 28 questions.
Curated OER
The Phone Bill Problem
Students write an equation for a linear function. In this algebra lesson, students collect data, plot it and graph it. They identify the equation of the graphed data and define the slope and y-intercept of the graph.


