Curated OER
Graphing Rational Functions
Learners complete an activity, included, of the information on asymptotes and intercepts. They also solve and complete eight questions on graphing rational functions, file included. Finally, pupils summarize vertical asymptotes,...
Curated OER
Profitable Soda Stand
Am I making any money? Help learners determine if their fictitious soda stand is turning a profit. They graph linear equations using the slope and y-intercept and identify the best price to use to sell soda. They identify the domain and...
Curated OER
Linear Equations
Eighth and ninth graders solve and graph 42 different problems that include writing various equations and graphing them on a grid. First, they create a table for each equation and graph it on a grid locating the x-and y-intercepts. Then,...
Blogger
Slope Intercept Form (y=mx+b) Foldable
Each piece of the y=mx+b formula represents something important about graphing. Take those important ideas and connect them to each part of the formula with notes or examples underneath each tab representing y, m, x,...
Curated OER
Lessen the Loan
Middle-schoolers explore the concept linear equations. They use the internet to navigate through videos and problems. Pupils problem solve to determine rates of change, slope, and x and y-intercepts.
Curated OER
Writing Linear Equations in Slope-Intercept Form
For this math worksheet, young scholars are given three lines graphed on a coordinate grid. Students identify the slope, intercepts, and write an equation for each. Young scholars find the intercepts of a linear equation, and graph them....
Curated OER
Graphing Linear Equations
In this graphing linear equations learning exercise, 9th graders solve and graph 6 different problems that include various linear equations. First, they graph each equation using the x- and y-intercepts of each. Then, students graph each...
Curated OER
Graphing Linear Equations
In this graphing worksheet, students graph ten linear equations on each of the graphs provided. They first plug in some values to the given equation using a T-chart. This will give them their coordinates to use on the graph and form...
Curated OER
Chapter 5 - Objective 3.1 Slope Intercept
In this slope intercept worksheet, students graph equations using the slope and the y-intercept. This one-page worksheet contains three problems.
Curated OER
Piecewise-Defined Functions 2
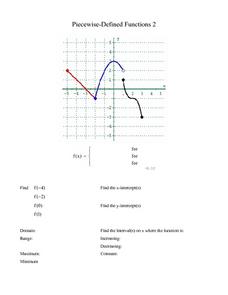
In this Piecewise-Defined function worksheet, 10th graders identify the function for a given graph. Additionally, they find the y-intercept, y-intercept, domain, range and interval of each function. Students solve this information for...
Curated OER
Graphs
In this algebra worksheet, students solve three linear equations to by substitution to determine if the given point is a solution. Students graph and determine the slope and y-intercept of 5 linear equations.
Curated OER
Finding X and Y Intercepts
How can you solve systems of linear equations? This slideshow introduces learners to the substitution method, the elimination method using addition and subtraction, and the elimination method using multiplication. Guided practice...
Curated OER
Writing Linear Equations
In this Algebra I/Algebra II worksheet, students examine linear equations to determine the slope and y-intercept and write the equation of the line given the pertinent information. The one page worksheet contains a combination of...
Curated OER
Linear Functions
In this linear function learning exercise, learners examine graphs and determine the slope, the y-intercept and the equation of a line. They identify parallel and perpendicular lines. This two-page learning exercise contains 3 multi-step...
Curated OER
Slopes and Linear Equations
Students find the slopes of linear functions. In this graphing instructional activity, students analyze linear equations and calculate the slope of the line. They graph a line given the slope and y-intercept.
Curated OER
Graphing Exponentials
Bring your Algebra class to the computer lab! Using materials created by Texas Instruments, they explore exponentiasl and graphs. Be sure to download the correct materials (on the right side of the webpage) before having them walk...
EngageNY
The Line Joining Two Distinct Points of the Graph y=mx+b Has Slope m
Investigate the relationship between the slope-intercept form and the slope of the graph. The lesson plan leads an investigation of the slope-intercept equation of a line and its slope. Pupils realize the slope is the same as the...
Houston Area Calculus Teachers
Polynomial Graphing
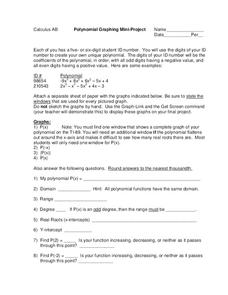
Your AP Calculus learners probably have their ID numbers memorized, but have they tried graphing them? Pique your pupils' interest by asking each to create a unique polynomial function based on their ID numbers, and then analyze the...
Flipped Math
Unit 1 Review: Analyze Graphs and Expressions
Get in one last practice. Pupils work through 12 problems and a performance task to review the topics in Unit 1. The problems cover analyzing and modeling with graphs, algebraic properties of equality, and adding, subtracting, and...
Curated OER
Linear Equations
In this Algebra I worksheet, 8th graders write the equation of a line given two points and given a linear equation determine the slope, x-intercept, y-intercept, and graph the line. The five page worksheet contains ten...
Curated OER
Exploring Equations and Y-Intercept
Students graph linear equations using intercepts, find y-intercept, find x-intercepts and graph linear equations that use horizontal and vertical lines.
Curated OER
Info. From a Graph
In this graphing instructional activity, high schoolers answer 13 questions about 3 graphs. Students determine the degree, roots, y-intercepts, inflection points, multiplicity, etc. of three different graphs.
Curated OER
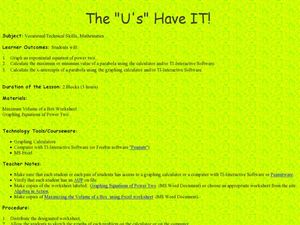
The "U's" Have IT!
Students explore the maximum and minimum values of parabola. In this exponential equations lesson, students use graphing calculators or TI Interactive Software to calculate values of parabola and graph x-intercepts of parabola.
Inside Mathematics
Graphs (2007)
Challenge the class to utilize their knowledge of linear and quadratic functions to determine the intersection of the parent quadratic graph and linear proportional graphs. Using the pattern for the solutions, individuals develop a...


