Curated OER
Water Cycle: Weather Lesson 1
First graders go on a water walk, collect weather data, and measure rainfall for a month. They examine the water cycle in this series of lessons.
Curated OER
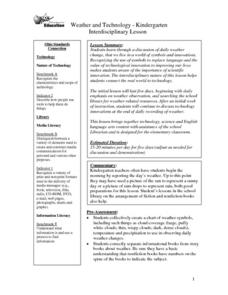
Weather and Technology
Students discuss daily weather change, that we live in a world of symbols and innovations. They recognize the use of symbols to replace language and the value of technological innovation to improving our lives.
Curated OER
Understanding Canadian Weather Extremes
Students research and analyze the causes and sources of Canada's extreme weather conditions. They conduct an experiment, complete a worksheet and predict the most likely locations for extreme weather conditions.
Curated OER
Weather
Students read a weather map. Using the local newspaper, Columbus Dispatch, small groups investigate that air has pressure and that temperature and pressure are inversely related in weather. They display their findings on a graph or...
Curated OER
Graph Those Stickers!
Students graph fruit. In this graphing lesson students create a graph using fruit label stickers. Students place a sticker on the graph when the fruit has been consumed.
Curated OER
The Hudson's Ups and Downs
Fifth graders practice interpreting line graphs of the Hudson River water levels to assess the tides and tidal cycles in the estuary. They explore how weather can affect water levels and tides and observe that high tides and low tides...
Curated OER
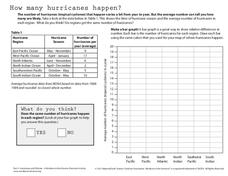
How Many Hurricanes Happen?
In this hurricanes worksheet, learners use a data table showing the hurricane region and the average number of hurricanes per year to determine if the same number of hurricanes happen in each region by creating a graph. Then students...
Curated OER
Earth Science
In this Earth science instructional activity, 4th graders answer multiple choice questions about temperature, weather instruments, heat, light, and more. Students complete 25 questions.
Curated OER
Weather Report
Students prepare a weather script for a broadcast. For this weather broadcasting lesson, student record the present temperature, high temperature, a sky watch, and the current moon phase to be presented in a school broadcast at the...
Curated OER
Seasonal Graphs
In this math worksheet, learners create a graph using the data recorded from the local newspaper concerning local temperatures.
Chicago Botanic Garden
Historical Climate Cycles
Scientists use ice core samples to obtain temperatures of the earth from 400,000 years ago! The third of five lessons instructs pupils to interpret historical climate data to see changes over time. In part I, participants interpret...
Curated OER
Let the Weather Help You Dress
Students observe weather daily for at least a month and graph the weather for one month. Then they use weather vocabulary such as sunny, windy, rainy, stormy, cold, snowy, foggy, and hot, and share their predictions about weather. ...
Curated OER
Bar Graphs
Students perform operations and graph their data using charts and bar graphs. In this algebra lesson, students follow specific steps to make a bar graph. They create a survey about people favorite things and plot their data from the...
Curated OER
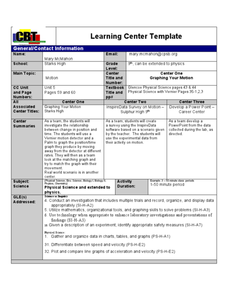
"Graphing Your Motion"
Students study the concepts of motion, velocity, and acceleration through graphing their own movement using LoggerPro. They explain the difference between speed and velocity using the weather vane example. They discover the difference...
National Geographic
The Monsoon
Few things are as fascinating as the challenge of climbing Mount Everest. This lesson investigates how monsoon weather impacts climbers. To begin, you are instructed to show various video clips. The only one directly provided, however,...
National Wildlife Federation
The Tide is High, but I’m Holding On… Using ICESat Data to Investigate Sea Level Rise
Based on the rate of melting observed from 2003-2007 in Greenland, it would take less than 10 minutes to fill the Dallas Cowboys' Stadium. The 17th lesson in a series of 21 has scholars use the ICESat data to understand the ice mass...
Curated OER
Weather Instrument Data Chart 2
In this science worksheet, high schoolers look for the data that is needed to fill in the graphic organizer. The prefixes are given that are needed to sort the information as it is collected.
Curated OER
Graph and Compare the Adventure's Temperature Vs. Local Temperature
Learners explore the concept graphing data. In this graphing data lesson, students use weather data from their local weather and some other city and graph them. Learners plot the local weather vs. another city. Students record...
Curated OER
Calendar & Weather Book
Second graders track weather patterns through the school year. They take daily readings and record them in a weather book.
Curated OER
Weather... Or Not
Students observe and discuss the local weather patterns, researching cloud types and weather patterns for cities on the same latitude on the Internet. They record the data for 6-8 weeks on a graph, and make weather predictions for their...
Curated OER
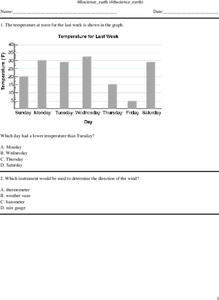
Good Weather
For this graphing data worksheet, students complete a temperature chart and then answer two questions about the weather for that week.
Curated OER
How's the Weather?
Students explore earth science by researching the Internet. In this weather pattern lesson, students utilize the website weather.com to analyze the weather in different geographic locations. Students view charts and graphs based on...
Curated OER
Make a Bar Graph
In this bar graphs learning exercise, students use the tally chart to make a bar graph. Students color one box for each tally mark and then use the chart to help answer the questions about the sunny, cloudy, and rainy days.
Curated OER
Reading A Weather Map
Ninth graders construct a weather map. In this meteorology lesson, 9th graders construct a weather map using contour lines and temperature.
Other popular searches
- Weather Graph
- Kindergarten Weather Graph
- Fall Weather Graph
- Daily Weather Graph
- Culture Weather Graph
- Graph Weather Chart
- Weather Graph Template
- Weather Graph Paper
- Math Data Graph Weather
- Weather Graph 1st Grade
- Local Weather Graph
- Local Weather Line Graph

