Curated OER
Analyzing Tree Rings to Determine Climate Change
Students examine how to locate and access data sets. In this climate change activity students import data into Excel and graph it.
Curated OER
Is Grandpa Right, Were Winters Colder When He Was a Boy?
Students compare current weather data to historic data to see if there is a temperature change. In this weather lesson students complete a lab activity and determine average changes in temperature, precipitation and cloud cover.
Curated OER
Is Portland, Oregon Experiencing Global Warming?
Students use data to determine if the climate in Portland has changed over the years. In this weather lesson plan students complete line graphs and study long wave radiation.
Curated OER
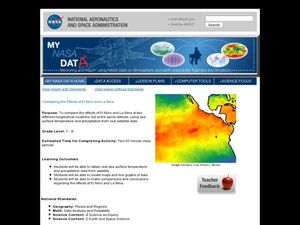
Comparing the Effects of El Nino and La Nina
Students examine the differences between an El Nino and La Nina year. In this investigative lesson students create maps and graphs of the data they obtained.
Curated OER
Regents High School Examination: Physical Setting Earth Science 2009
This extensive earth science practice test is composed of 50 multiple choice questions and 31 short answer questions. The questions cover weather, the water cycle, geology, the solar system, and more. Many of the short answer questions...
Curated OER
Regents High School Examination: Physical Setting Earth Science 2007
This comprehensive earth science practice test is composed of 50 multiple choice questions and 32 short answer questions. The questions cover weather, the water cycle, geology, the solar system, and more. Many of the short answer...
Curated OER
Regents High School Examination: Physical Setting Earth Science 2008
Throughout this earth science exam, high-school geologists complete a series of multiple choice and short answer questions about the solar system, atmosphere, and earth system. This is an amazing test, as are all of the exams developed...
Curated OER
What's The Weather?
Second graders record and summarize daily weather observations for a week in the form of a bar graph. They cut and glue a weather symbol for each day, record it on the graph, and answer discussion questions.
Curated OER
Recording Local Weather
Second graders measure, record, graph, and report changes in local weather using Navajo, Ute, and Spanish words for weather conditions. They record the weather results on a graph, and create drawings of weather conditions.
Curated OER
Weather Maps
Students interpret information on a weather map in order to construct a graph, and discuss how the weather impacts their lives.
Curated OER
Weather Graphs
First graders use their knowledge of weather symbols to organize and construct a graph of the daily weather for one month. Each student have a chance to give the daily weather report using Sammy's Science House Computer Software.
Curated OER
Weather "Whys" Lesson 4: Spring
Pupils explore the attributes of spring. In this weather lesson, students collect data regarding weather from various media. Pupils graph simple weather data and dress animals for forecasted weather. Students discuss the characteristics...
Curated OER
Weather Patterns
Fourth graders collect and chart weather data over the course of the school year either using tools at school or media resources. They agree on weather terms to use in their observations and write them on the assigned sheet. Finally,...
Curated OER
Weather Awareness
Second graders investigate weather. In this weather lesson, 2nd graders discover how to read a temperature gauge, keep track of the weather, and find out how the weather affects their day. They work individually and in partners to make...
Curated OER
Weather
Students participate in a variety of mini-lessons including experiments, literature readings, physical education components, music, data gathering and recording and more to expose them to several themes of weather; i.e. water cycle,...
Curated OER
I'm a Weather Watcher Watching plants grow by......my,my,my
Students investigate how weather affects how plants grow. They collect data on weather and plant growth for a week and display the data on a graph. For a culminating experience they design a movie using software that shows plant growth...
Curated OER
Weather: Like It or Not!
Second graders investigate daily weather changes. For this earth science lesson, 2nd graders identify the different terms used to describe weather. They use the outdoor thermometer to record data.
Curated OER
Watching the Weather
Students examine the weather. They discover the conflict between man and nature caused by the changes in weather and the impact it has upon their lives. Students explore weather folklore. They write a report on the weather. ...
Curated OER
Weather Graph
In this graphing worksheet, 3rd graders study a line graph pertaining to weather. Students respond to 8 short answer questions using the information that is presented in the graph.
Curated OER
Weather through the Seasons
Students examine the year's cycles by observing the four seasons, their distinctive weather patterns that affect our activities and the weather changes that each brings. The fourteen lessons of this unit offer a good opportunity for the...
Curated OER
Under the Weather
Students review mean, median, mode, and range while using the newspaper to answer weather questions.
Curated OER
Weather Watchers
Students practice using objective and quantitative means to describe and compare the weather. They compile weather conditions and create a spreadsheet to record their findings.
Curated OER
Interpreting Graphs: Temperate Climates
In this interpreting graphs activity, students read a graph containing data of rainfall and temperature, then complete 18 questions, interpreting the data.
Curated OER
Weather Watchers
First graders study changes in daily weather conditions. They explore weather pattern consistency.
Other popular searches
- Weather Graph
- Kindergarten Weather Graph
- Fall Weather Graph
- Daily Weather Graph
- Culture Weather Graph
- Graph Weather Chart
- Weather Graph Template
- Weather Graph Paper
- Math Data Graph Weather
- Weather Graph 1st Grade
- Local Weather Graph
- Local Weather Line Graph


