Utah Education Network
Uen: Weather Watchers
Students will use weather instruments and the Internet to monitor the weather for a week. They will make graphs that compare weather factors analyze their relationships.
Alabama Learning Exchange
Alex: What's the Weather Like?
Students will use the Internet to compare the weather forecast for their city with other cities throughout the United States each week during this unit. Data will be charted for a five-day period then analyzed and discussed.
University Corporation for Atmospheric Research
Ucar: Get the Picture Severe Weather
Students review graphs and charts of severe weather data then answer "True and False" questions about the content conveyed.
Utah Education Network
Uen: Recording Local Weather
Second graders will measure, record, graph and report changes in local weather utilizing Navajo, Ute, and Spanish words.
Ohio State University
Osu: Beyond Weather and the Water Cycle: The Sun: Earth's Primary Energy Source
Extensive article that discusses the first principle of climate science, i.e., that the Sun is the primary energy source for the climate system of the Earth. Presents five concepts for this principle and explains each, providing...
Better Lesson
Better Lesson: Graphing January's Weather
First graders graph the weather in Vermont for the month of January.
Geographypods
Geographypods: Weather and Climate Graphing It!
Explores the difference between weather and climate and how they are measured. Students will complete activities and construct a climate graph from raw data. They will also learn about the physical structure of the rainforest, its...
Illustrative Mathematics
Illustrative Mathematics: F if How Is the Weather?
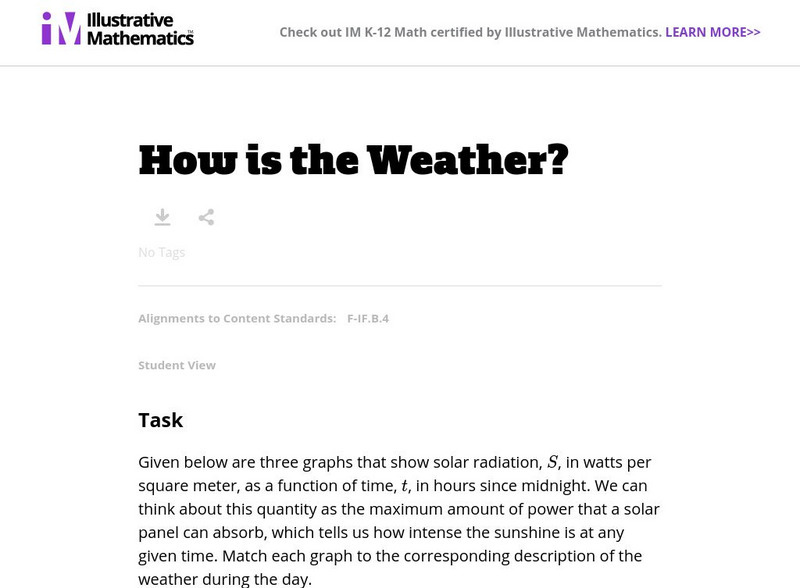
For this task, students are presented with three graphs that show solar radiation as a function of time. They are asked to match each graph to the corresponding description of the weather during the day. Aligns with F-IF.B.4.
University Corporation for Atmospheric Research
Ucar: Differences Between Climate and Weather
In this activity, students collect weather data over several days or weeks, graph temperature data, and compare the temperature data collected with averaged climate data where they live.
Illustrative Mathematics
Illustrative Mathematics: F if Telling a Story With Graphs
For this task, students are presented with three weather-related graphs - on temperature, solar radiation, and precipitation. They are asked to describe the function represented in each graph and tell a more detailed story using...
Science and Mathematics Initiative for Learning Enhancement (SMILE)
Smile: Aspects of Weather
A detailed weather lesson plan written for the primary, intermediate, and junior high level. Topics covered are weather symbols, thermometer, graphing temperature results, clouds, moisture and air pressure.
Concord Consortium
Concord Consortium: Smartgraphs: Hurricane Katrina
Students are given graphs relating to Katrina, the hurricane that devastated New Orleans and much of the gulf coast in 2005, and are asked to identify various events, such as the moment when the hurricane made its closest approach to New...
Math Graphs
Houghton Mifflin: Math Graphs: Direction and Vectors 3 [Pdf]
Students use a weather map to determine the points where the wind speed is the greatest. The resource consists of an enlarged printable version of a weather map available in PDF format.
TeachEngineering
Teach Engineering: Design Weather Instruments Using Lego Sensors
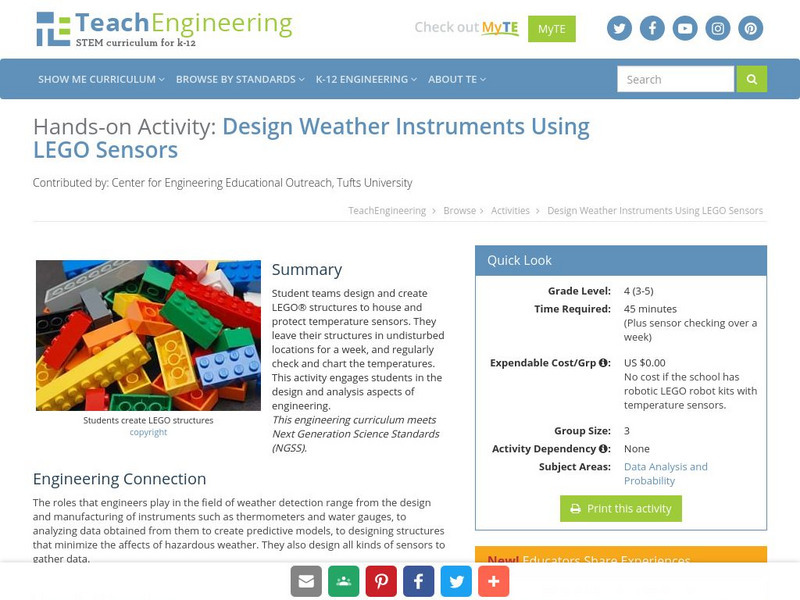
Students will design and create a LEGO structure that will house and protect a temperature sensor. They will leave the structure in a safe spot and check the temperature regularly and chart it.
NOAA
Noaa: Outflux: City Climate Comparisons
An interactive comparable climate data tool where the user chooses from a list of United States cities and several weather factors. The immediate result is a graph or graphs of historical US city data.
Better Lesson
Better Lesson: Comparing the Weather
In order to meet Common Core standards, 2nd graders need to be able to interpret data to solve problems. This lesson provides practice in this area. Included in this lesson are a printable temperature chart and a video of second graders...
University Corporation for Atmospheric Research
Ucar: Introduction to Climate
A detailed overview of the Earth's climate, with explanations about the difference between weather and climate, dendrochronology, palynology, and how Earth's climate has changed over time. All information is reinforced through pictures,...
Science Education Resource Center at Carleton College
Serc: Drought
Eight online learning labs which focus on the effects of drought, the quiet disaster. Each module takes students to external sites containing data, graphs, and articles. Several labs also require additional software programs: a...
Texas Education Agency
Texas Gateway: Scientific Investigation and Reasoning Data Organization
Using interactive exercises, students will review how to construct tables and graphs in order to organize data.
TeachEngineering
Teach Engineering: Engineering for the Earth
Young students are introduced to the complex systems of the Earth through numerous lessons on its natural resources, processes, weather, climate and landforms. Key earth science topics include rocks, soils and minerals, water and natural...
University of Illinois
University of Illinois Urbana Champaign: Forces and Winds
What causes wind? How does wind affect our weather? This website is neatly organized into topics about pressure, gradient force, Coriolis force, geostrophic wind, gradient wind, friction, boundary layer wind, and sea and land breezes....
Geographypods
Geographypods: Hazards and Risk Management: Tropical Storms
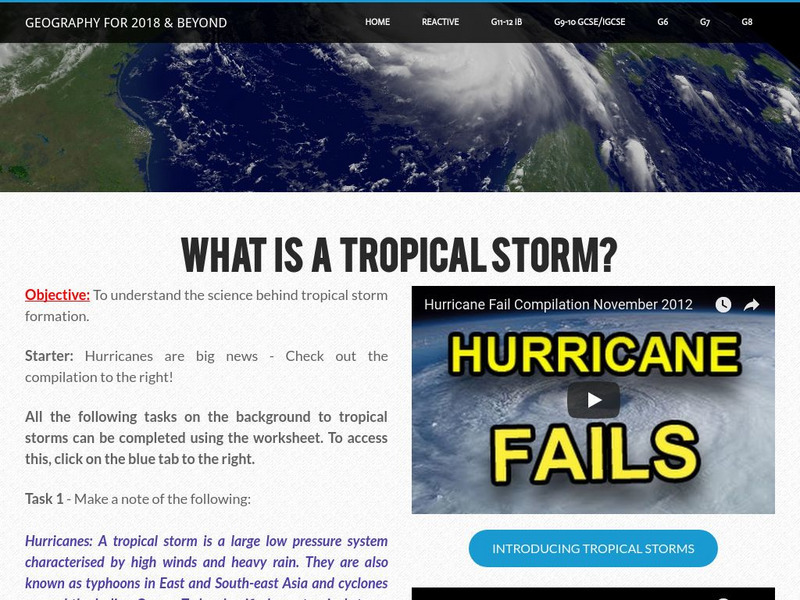
This learning module looks at tropical storms. It explains the characteristics of a tropical storm, how they form, how they are predicted, and their frequency. Includes student tasks, graphs, videos, and an interactive animation of...
TeachEngineering
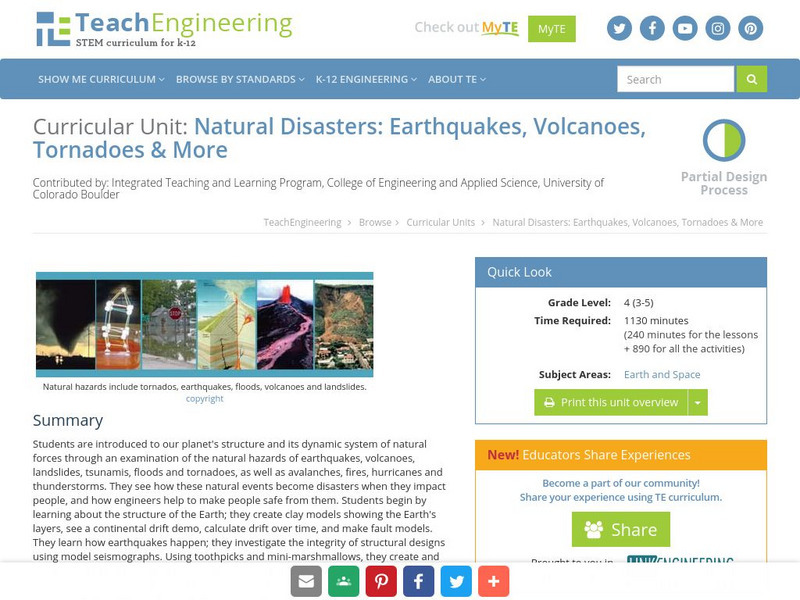
Teach Engineering: Natural Disasters
Students are introduced to our planet's structure and its dynamic system of natural forces through an examination of the natural hazards of earthquakes, volcanoes, landslides, tsunamis, floods and tornados, as well as avalanches, fires,...
University of Illinois
University of Illinois: Earthquakes of the World
Resource contains a lesson plan that utilizes data from earthquakes. Students are instructed to analyze and interpret line graphs that display the earthquake data.
Other popular searches
- Weather Graph
- Kindergarten Weather Graph
- Fall Weather Graph
- Daily Weather Graph
- Culture Weather Graph
- Graph Weather Chart
- Weather Graph Template
- Weather Graph Paper
- Math Data Graph Weather
- Weather Graph 1st Grade
- Local Weather Graph
- Local Weather Line Graph


