Curated OER
Where's the Beach?
Students use beach profile data to analyze how erosion and sediment transport changed seashore slopes. In this geology lesson, students plot the data provided and analyze erosion patterns. They also assess coastal erosion management...
Curated OER
Retirement: Show Me the Money!
Students explore the concept of retirement finances. In this retirement finances lesson, students discuss what it means to save, invest, risk, or the time value of money. Students play the stock market game. Students interview a parent...
Curated OER
Planet Research
Pupils recognize that the other eight known planets, which revolve around the Sun, have characteristics and surface conditions that are different from Earth; and identify examples of those differences.
Curated OER
Coral Bleaching in the Caribbean
Students use authentic satellite data on the NASA website to determine when the sea surface temperature meets the criteria to induce coral bleaching.
Curated OER
Seasons' Journey : Putting it All Together
Third graders complete a diagram of the revolution of the earth around the sun and write a one paragraph explanation of the factors that cause seasons.
Curated OER
Seeds of Life
Students match real seeds with the corresponding names of fruits and vegetables. They answer discussion questions, and glue the seeds on the correct squares of a chart.
Curated OER
Cloud Shadows
Young scholars classify clouds as transparent, translucent or opaque. They conduct an experiment to determine the visual opacity of several classroom objects and then conduct further observations of clouds.
Curated OER
Estimating Altitude of Water Cloud Base
Students conduct an experiment to determine dew point and use a formula to detemine altitude. They construct a chart and predict what altitude clouds would form, given the dew point on the ground.
Curated OER
Mapping My Trip to the 2002 Winter Olympics!
Eighth graders map their route from their local community to Salt Lake City, Utah for the Winter Olympics. Using atlases, they gather topographical information and use the internet to research any landmarks they might pass on the way....
Curated OER
Earthweek
Students explore the ongoing changes in the relationship between human beings and their physical world. They read articles on environmental changes. Students write a short analysis of the effect of the event on the residents of the area...
Curated OER
Making Sense of Journey North Maps
Young scholars use maps and answer core curriculum questions in order to increase comprehension and practice higher order thinking skills. This helps them develop writing skills through the practice of keeping Science Journals.
Curated OER
Careers in Science
Stuents explore the current job market for scientists. They explore types of jobs, salary range and job requirements. Students write a letter of application for a particular job.
Curated OER
Collect Your Own Drosophila Lab
Students study Drosophila by catching them. They construct catcher-containers to catch Drosophila using fruit as bait. After collection, they examine the flies and collect data to be displayed.
Curated OER
Run-off Race
Students create wetland models in pans and use them to experiment to see how plants help slow the flow of runoff water and keep our waterways clean.
Curated OER
European Newscast
Students work in cooperative learning groups to create and perform a newscast about a European country. This geography-based technology instructional activity concludes with class presentations and student critiques.
University Corporation for Atmospheric Research
Ucar: Weather and Climate Data Exploration
Students explore the relationship between weather and climate by graphing weather temperature data and comparing with climate averages.
Other
Honolulu Hi 5: Cool Maps With Awesome Weather Data Across 1,219 Us Cities
Explore the weather in states and cities across the United States. Two maps with accompanying graphs are provided. The first indicates the number of comfortably warm summer days a place has and the second shows the temperature and how...
Utah Education Network
Uen: Graphing the Weather
Fourth graders take weather readings using simple weather instruments and predict the weather.
Center for Innovation in Engineering and Science Education, Stevens Institute of Technology
Ciese Real Time Data Projects: Weather Scope: A Study of Weather and Climate
Use real-time data to study factors that affect weather and climate, create weather instruments, and share data with students around the world.
NASA
Nasa: Using Radiosonde Data From a Weather Balloon Launch
This lesson plan allows students to learn about the layers of the atmosphere and to learn how to graph real atmospheric data.
Illustrative Mathematics
Illustrative Mathematics: Weather Graph Data
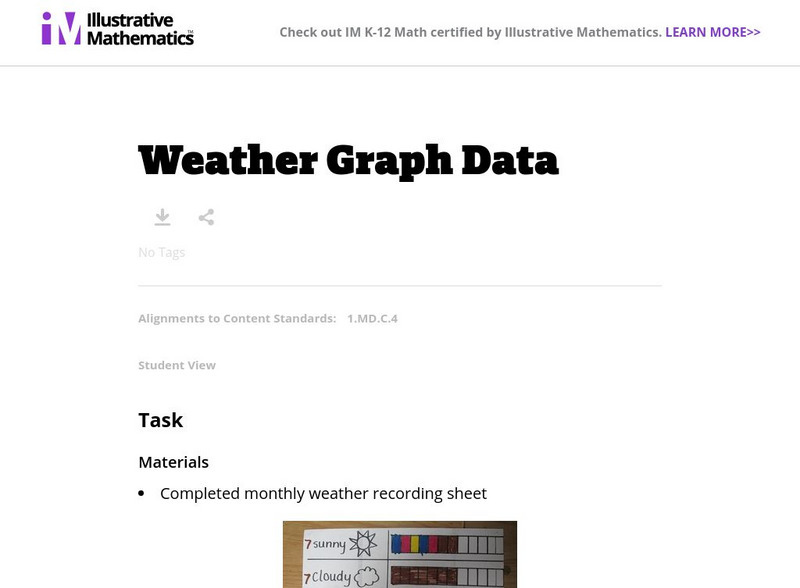
The purpose of this task is for students to represent and interpret weather data, as well as answer questions about the data they have recorded. Student worksheets and recording sheet are included.
PBS
Pbs Learning Media: What's Up With the Weather: Graphs
Examine this graph from FRONTLINE/NOVA: "What's Up with the Weather?" Web site to see dramatic increases in three greenhouse gases over the last two hundred years.
NASA
Nasa: Precipitation Towers: Modeling Weather Data
This lesson uses stacking cubes as a way to graph precipitation data, comparing the precipitation averages and seasonal patterns for several locations. Variations on the lesson can accommodate various ages and ability levels. Students...
Other popular searches
- Weather Graph
- Kindergarten Weather Graph
- Fall Weather Graph
- Daily Weather Graph
- Culture Weather Graph
- Graph Weather Chart
- Weather Graph Template
- Weather Graph Paper
- Math Data Graph Weather
- Weather Graph 1st Grade
- Local Weather Graph
- Local Weather Line Graph


